In this tutorial, the idea is to explore the potential of Isovist for urban analysis. Isovist is the surface or volume of space visible from a specific point. This concept has been proposed by Clifford Tandy in 1967 and then redefined by Michael Benedikt. Isovists are very useful to quantify the perception of urban spaces such as opening, closeness, and also useful to define urban envelopes. Isovists help to with non-intuitive solutions for complex problems.
In this example, we will see how to set up an environment, then use a simple Isovist System, then a more complex one with Ladybug. Then we will see a non-intuitive question: where a very high tower can be seen in a dense urban context.
Let’s dive.
Importing OSM data.
Depending on locations, OSM data can be exhaustive with roads, 2D buildings, 3D buildings and many more information. OSM are data that can be imported from Open street map. www.openstreetmap.org
In Openstreet Map we choose our area of study.
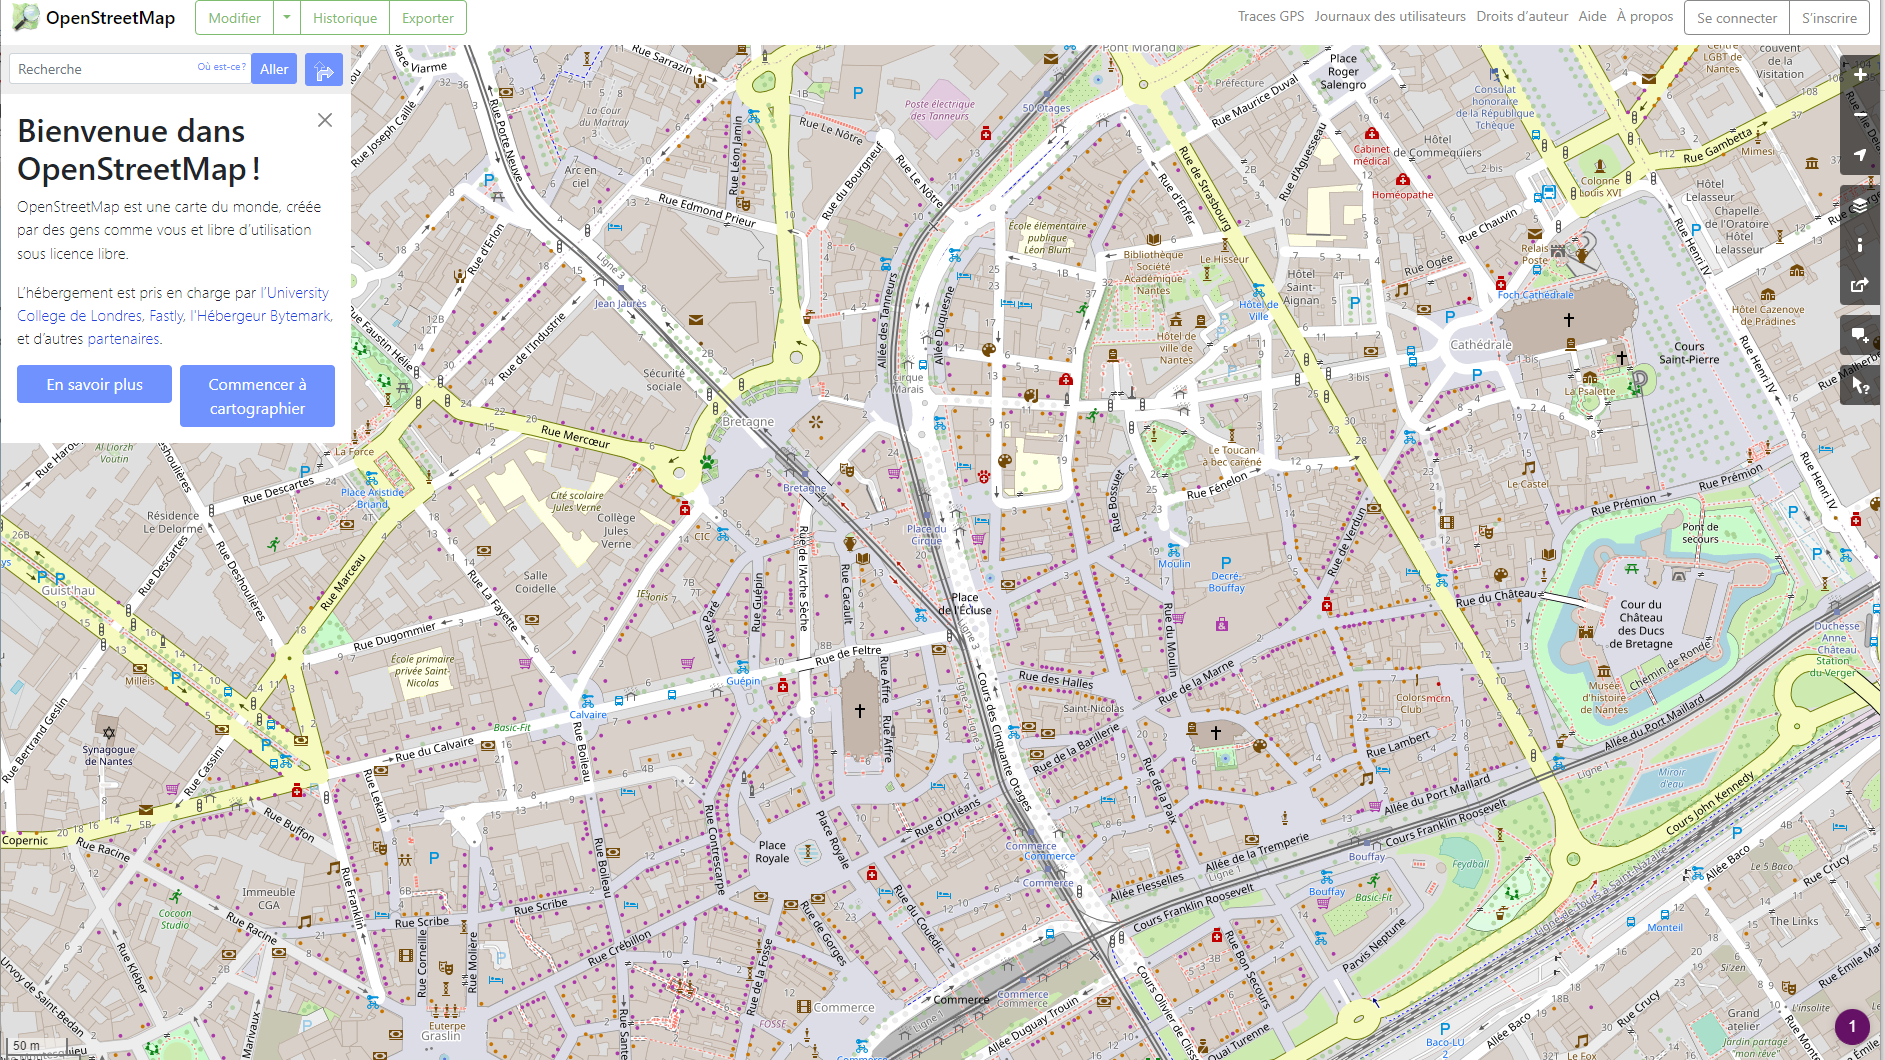
In Export we choose the area of study with manual export.
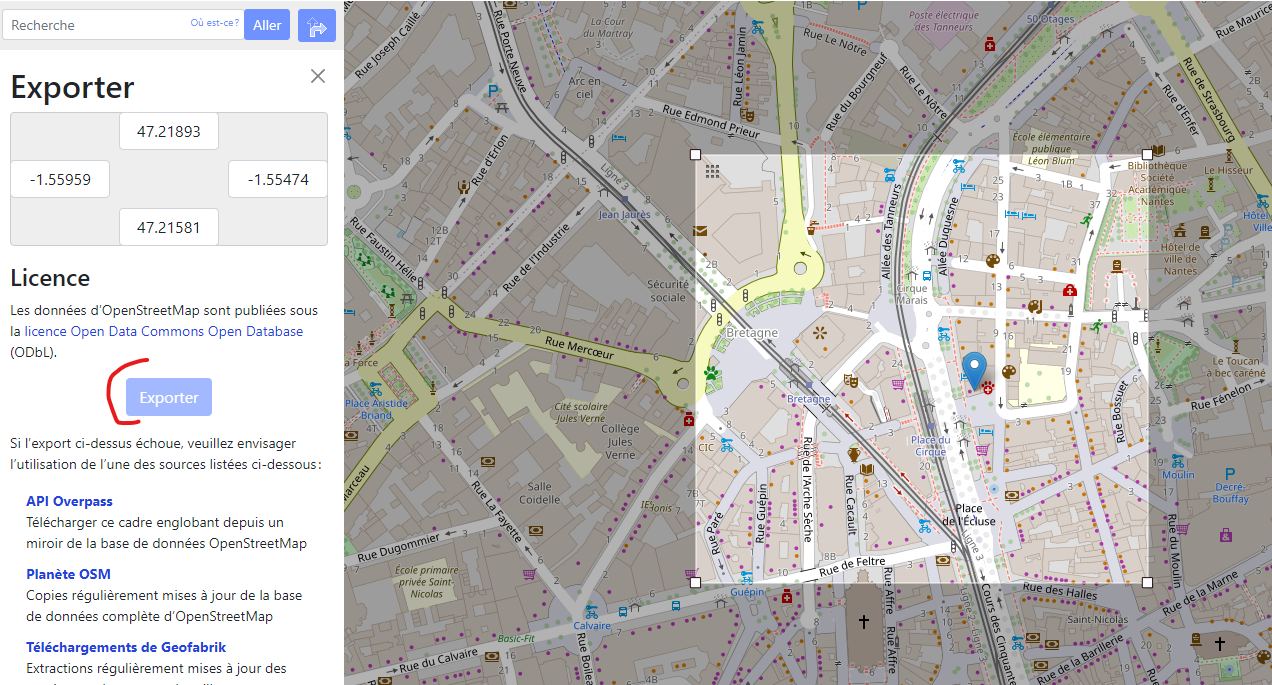
We get an map.osm file.
We rename it with the name of the location or area we are.
Grasshopper import
Grasshopper can import OSM files, but a new plugin is needed. This will be ELK that can be downloaded here: https://www.food4rhino.com/en/app/elk
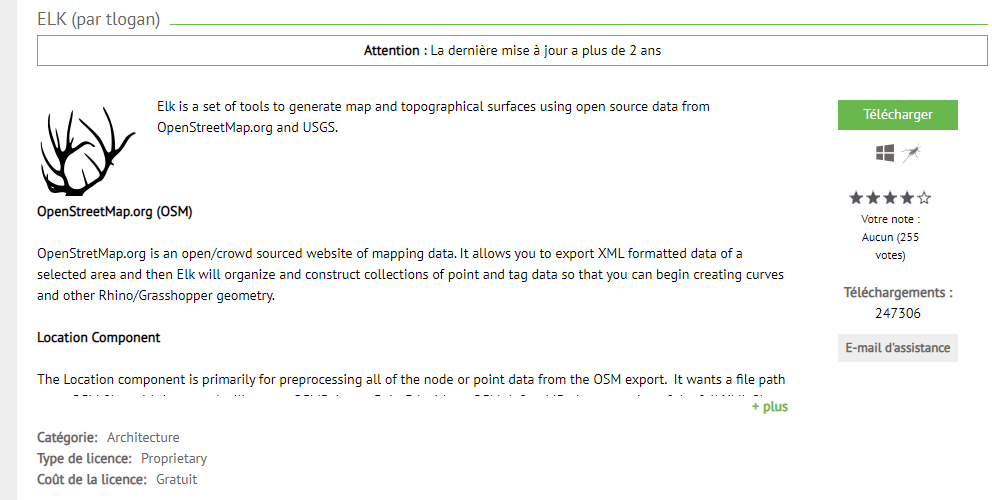
Choose Elk 2.2.2
To install, just drag and drop all elements on the grasshopper window.
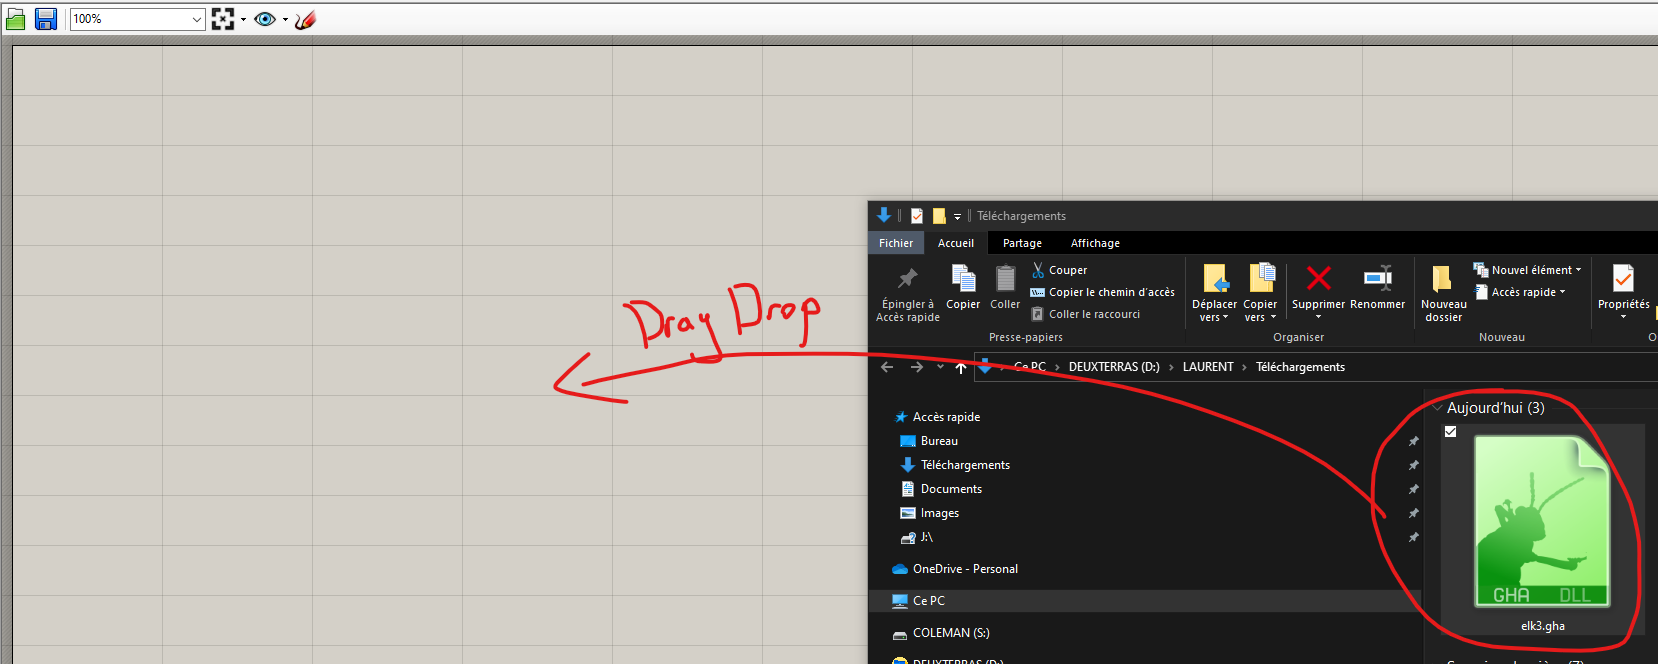
We now have the Elk Components

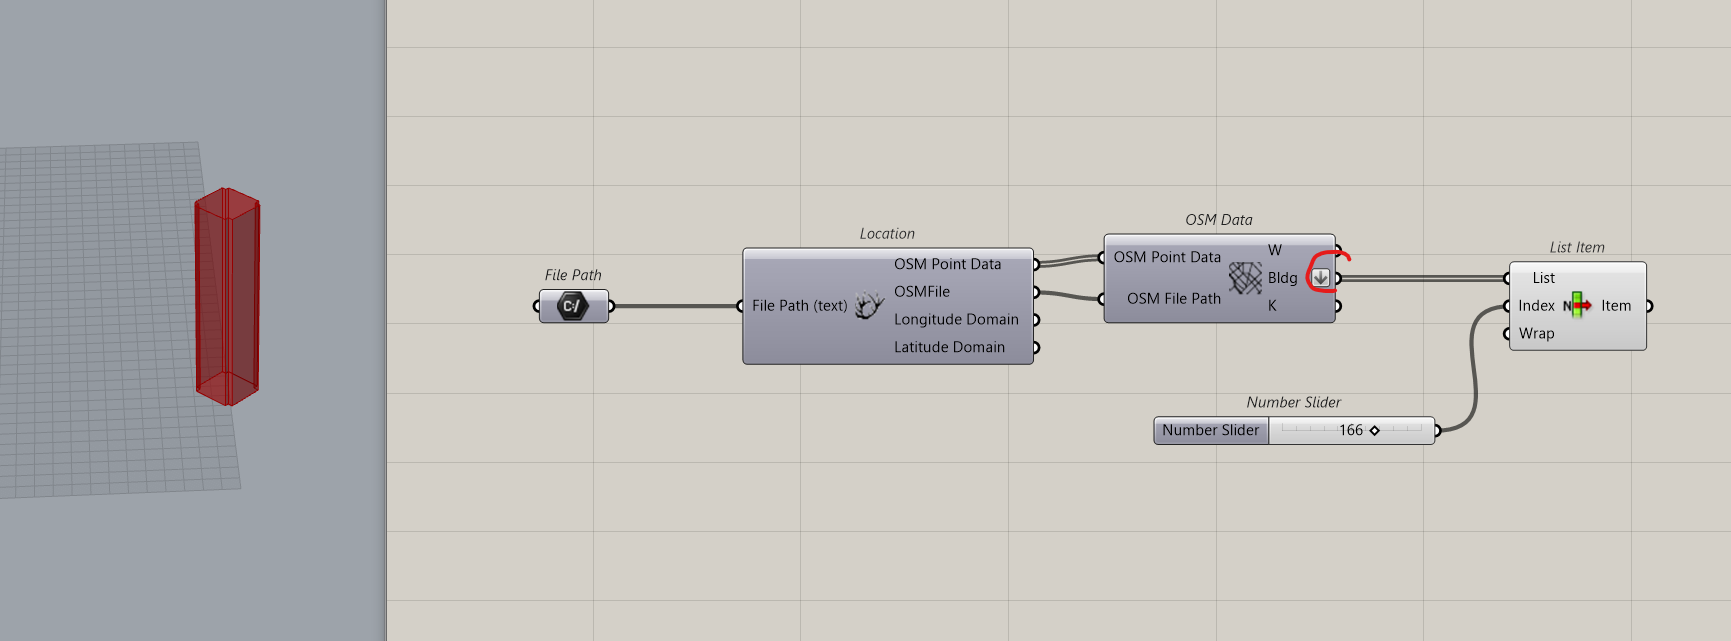
Set as followed: we prepare a File Path to import the OSM file that feed the Location Component.
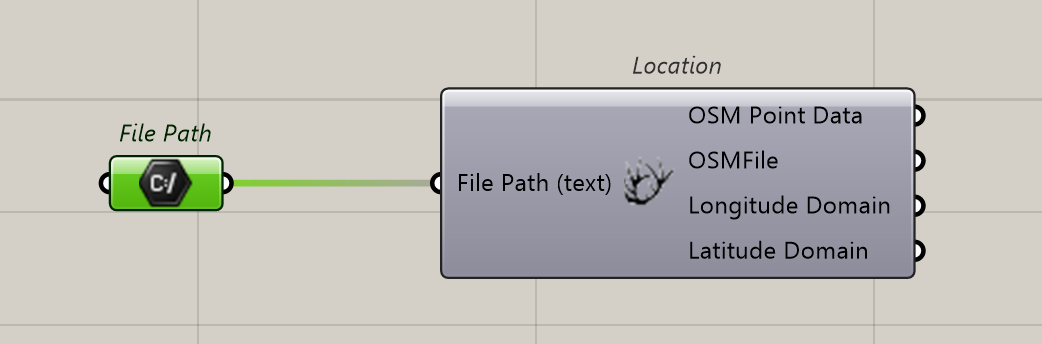
We connect OSM data and connect OSM Point Data and OSMFile
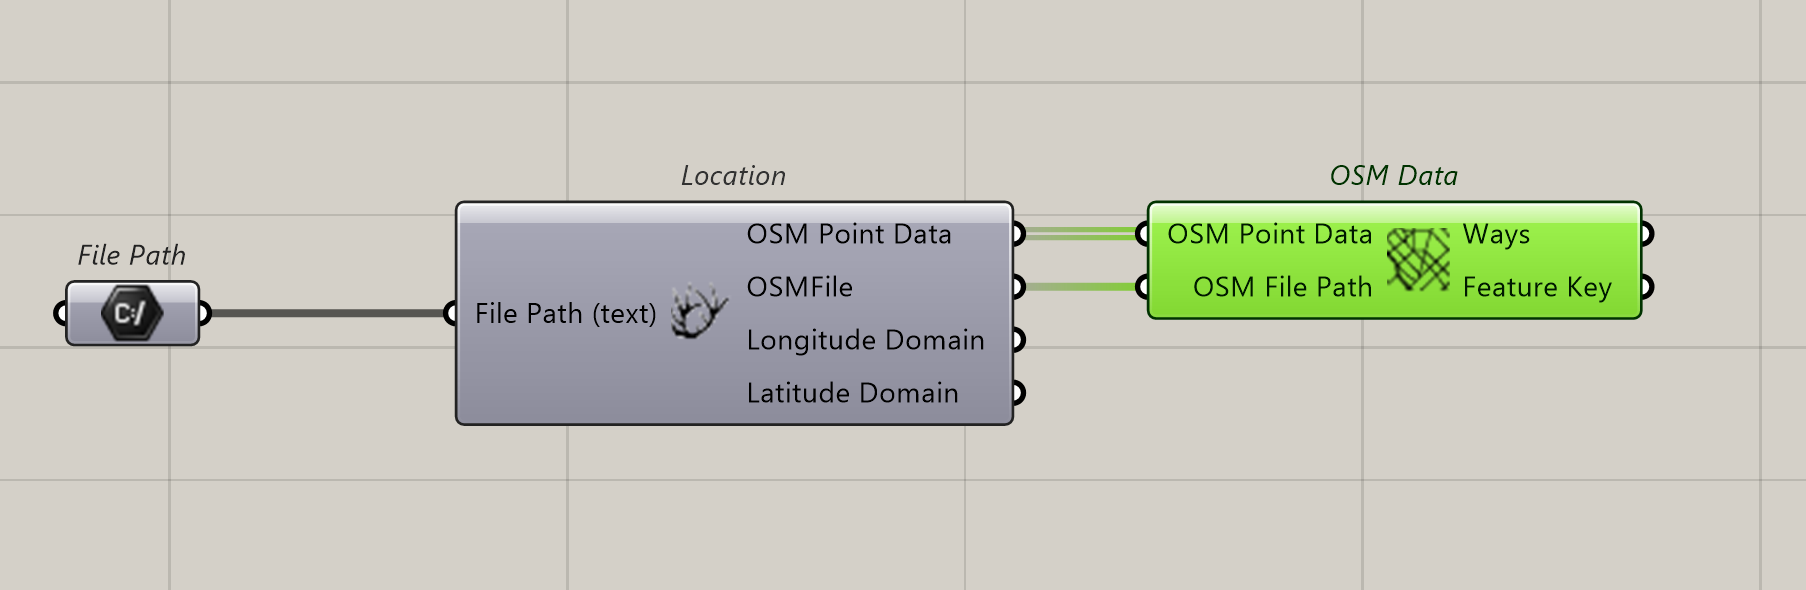
Nothing appears.
We right click on the component Icon and click on Create 3D Buildings
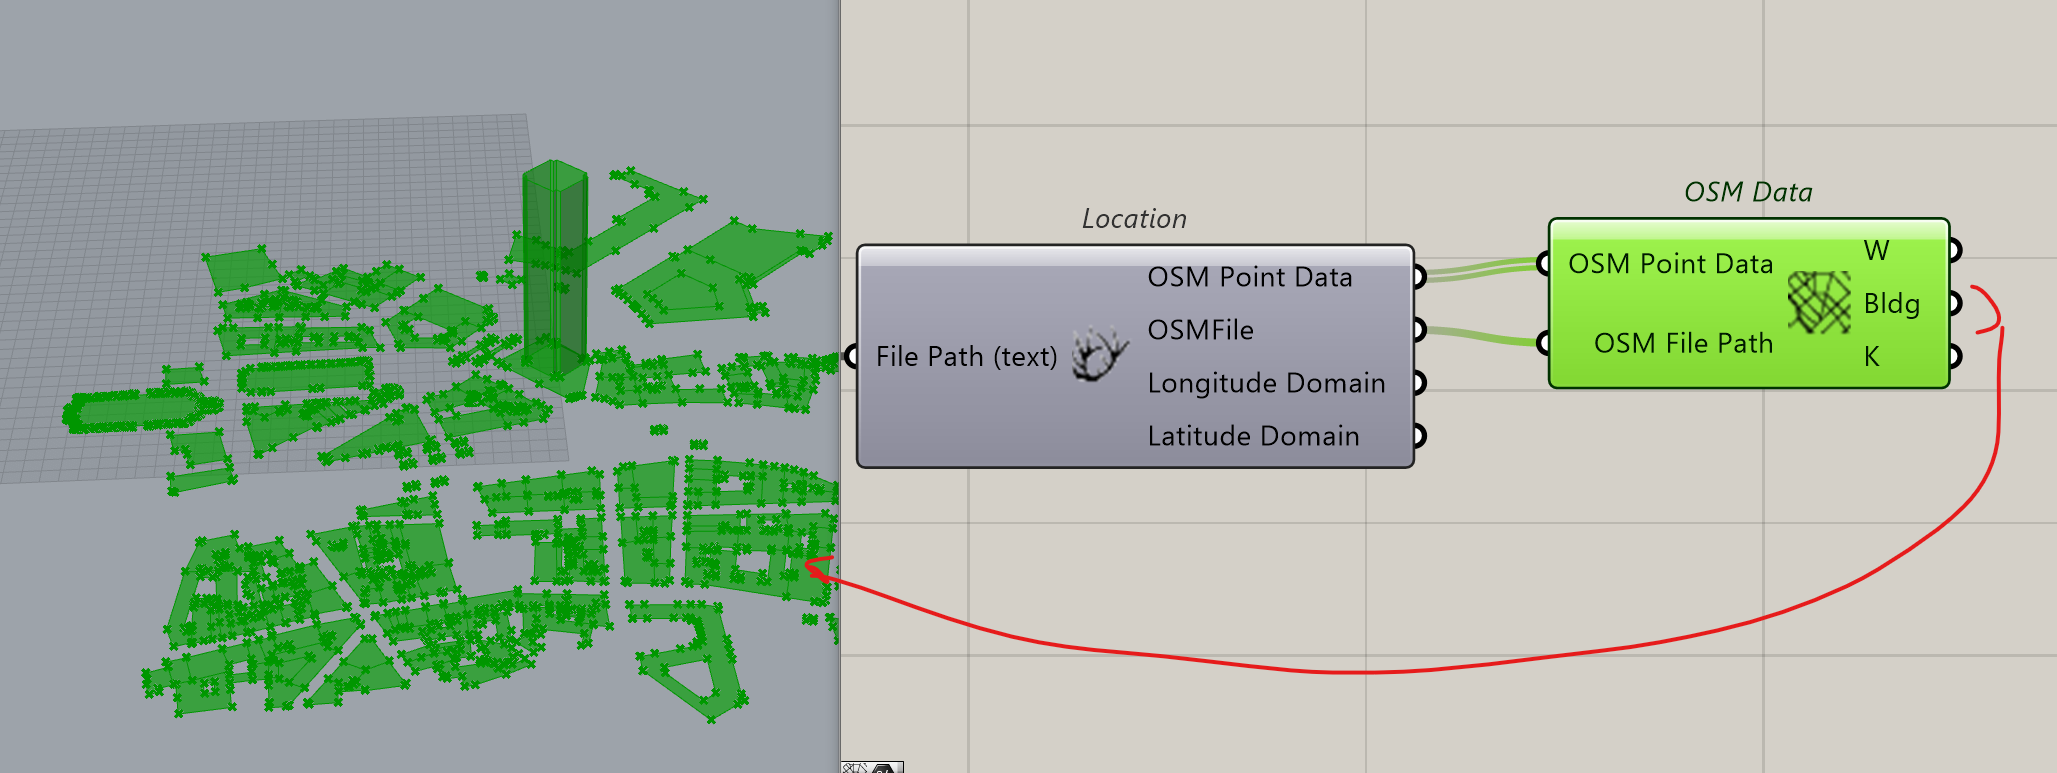
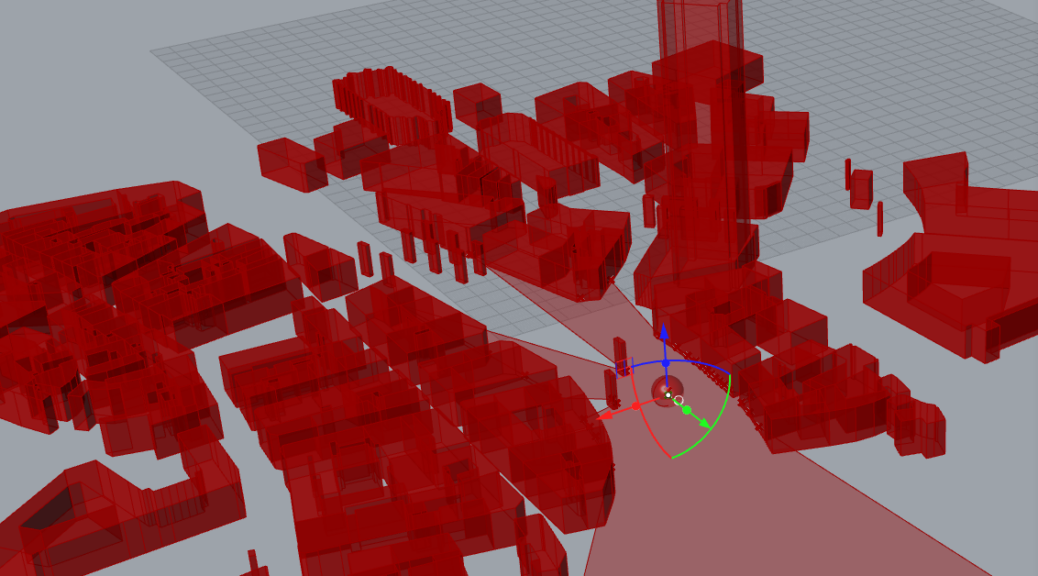
In our case, we are very poor in 3D buildings. Too bad.
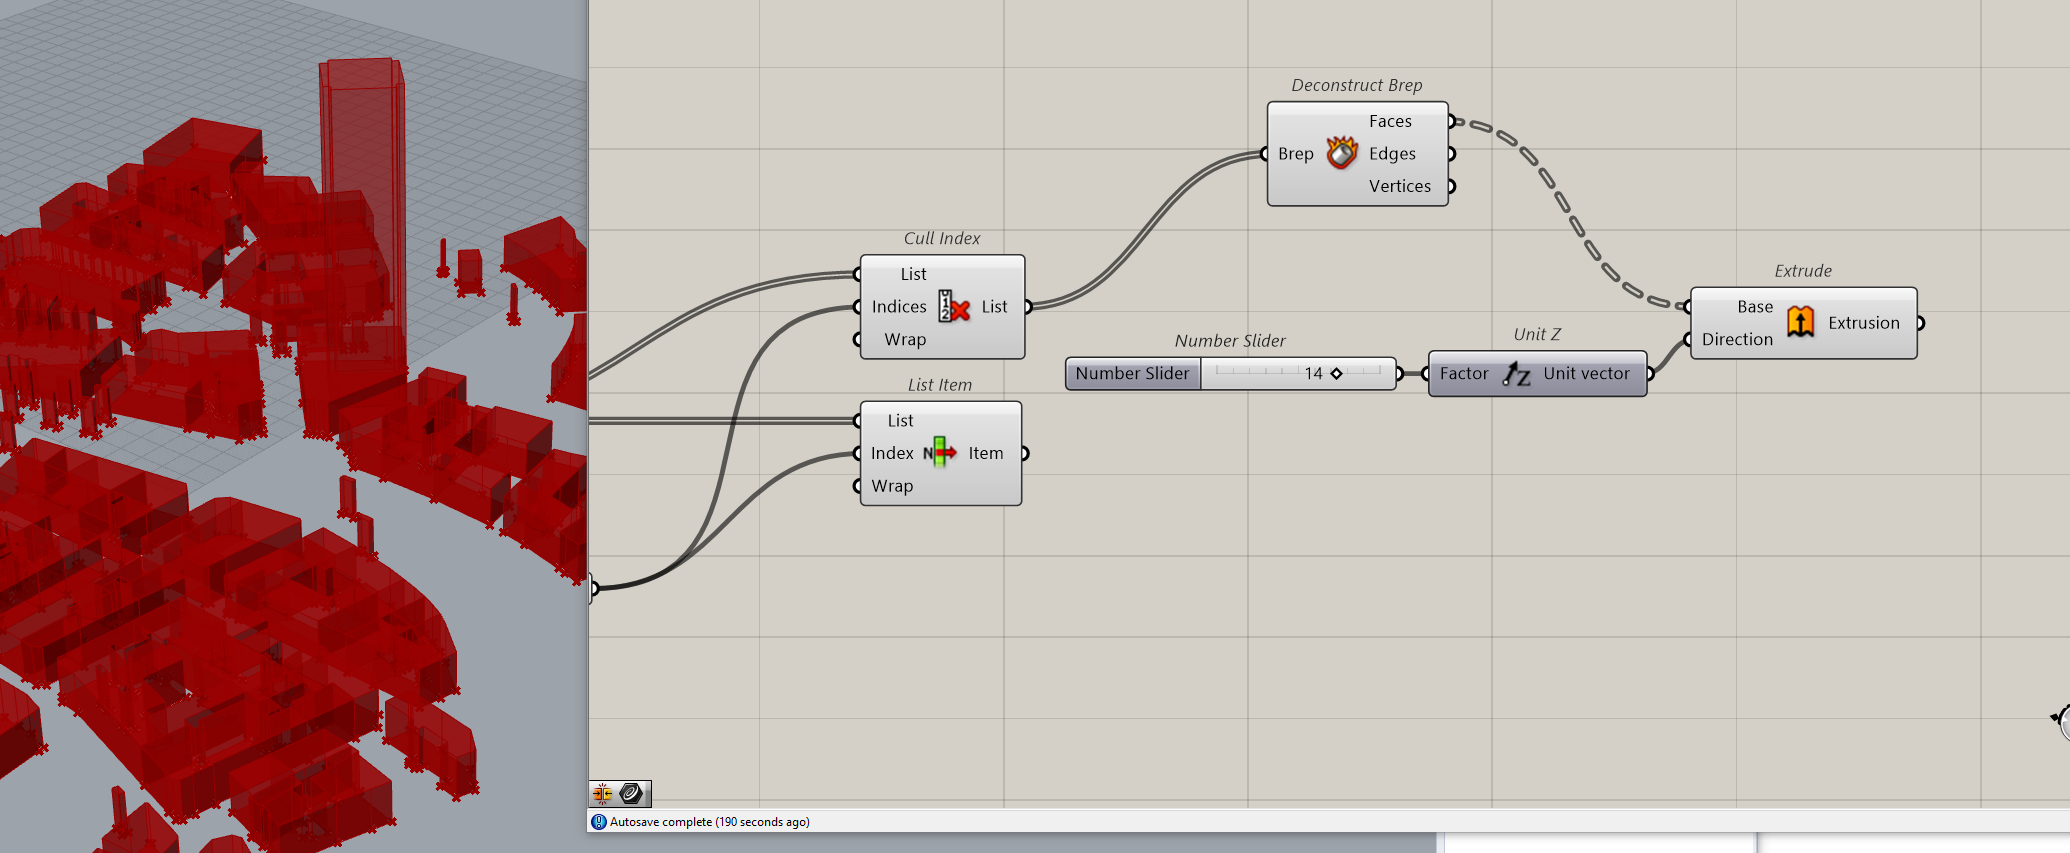
In this situation we’ve got the tower that is what we will study. We will have to filter the data to find and isolate the tower
It is possible to number all shapes using this structure.
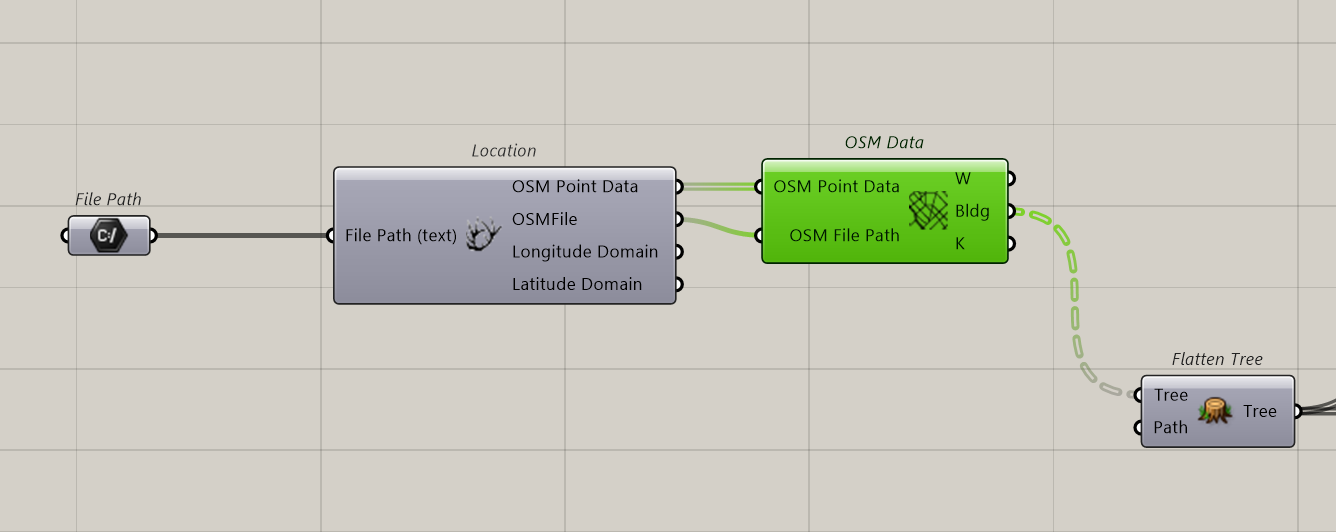
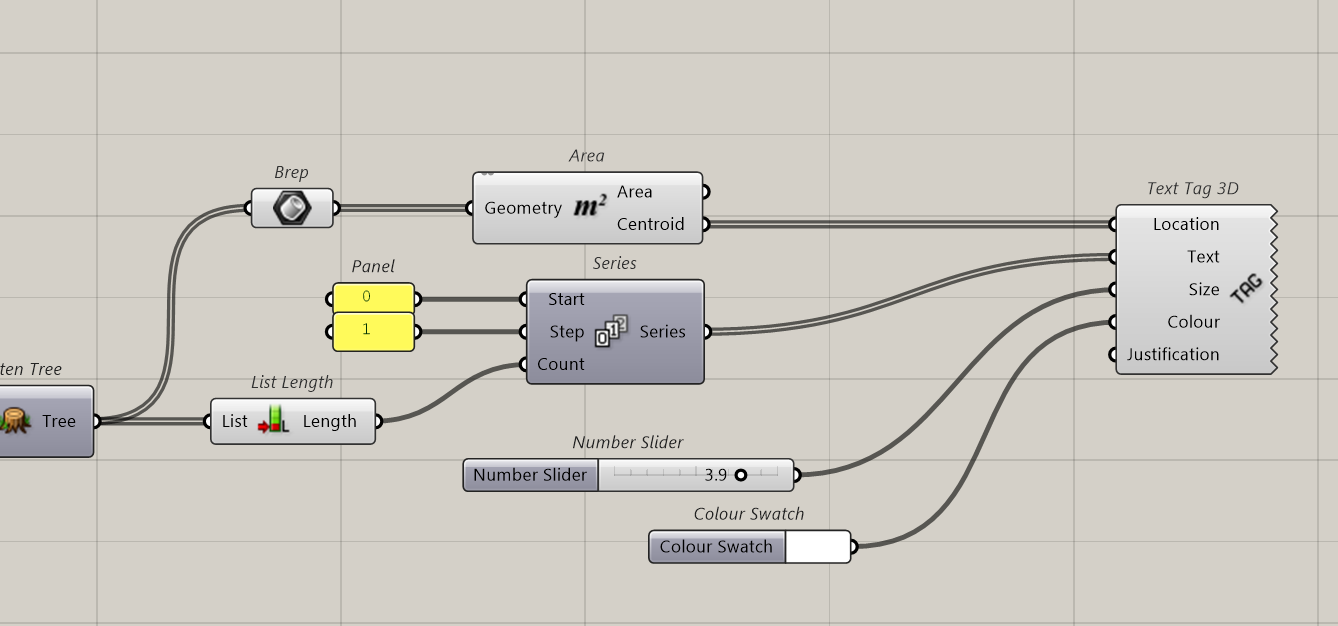
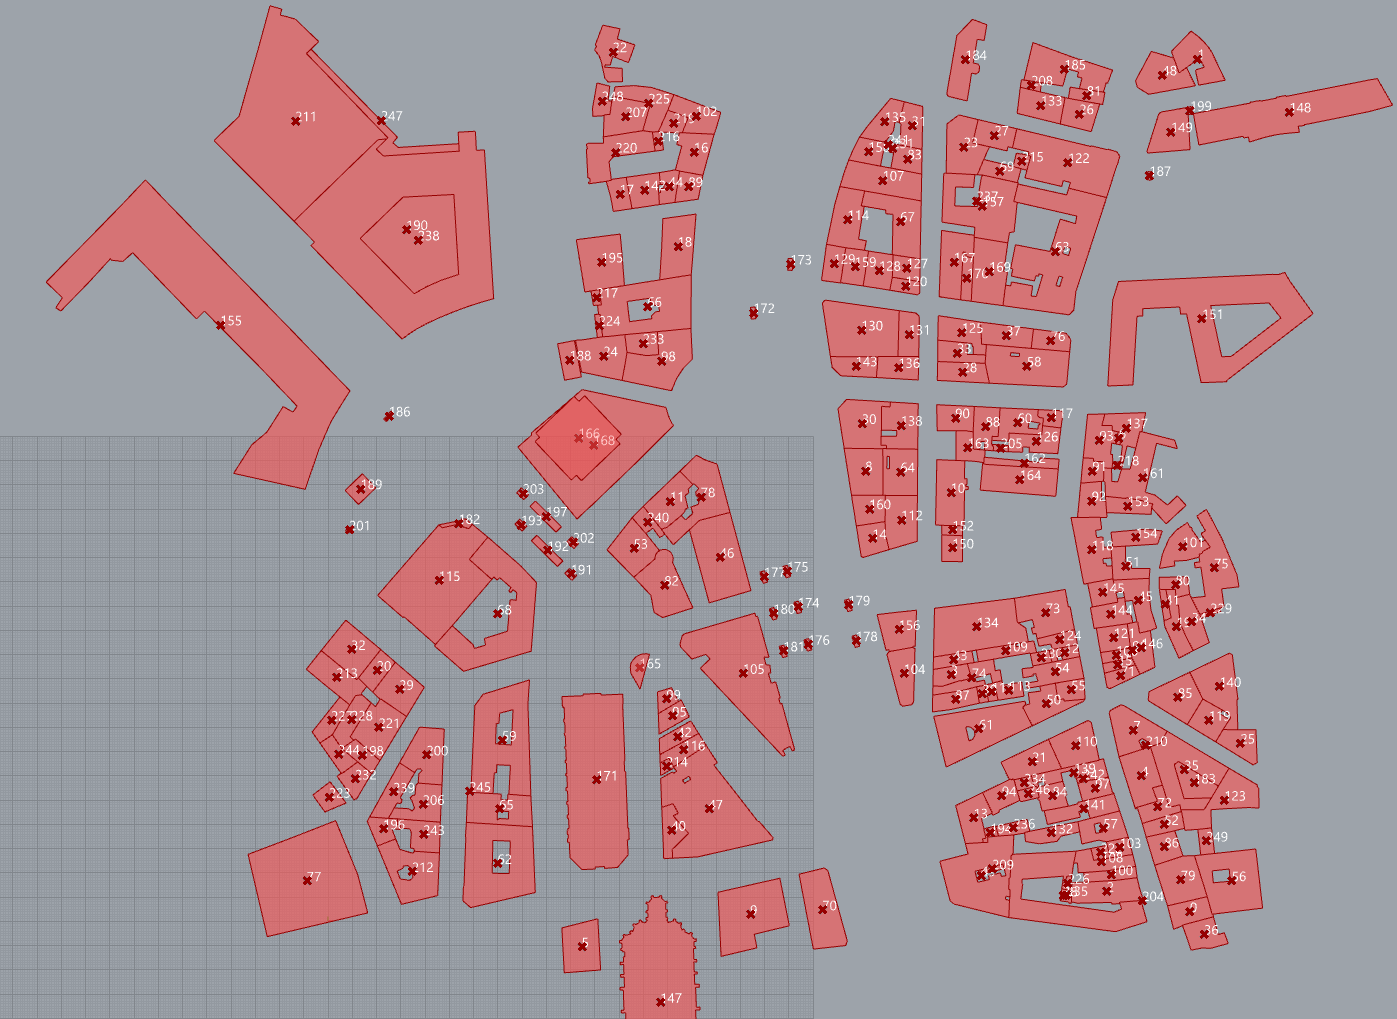
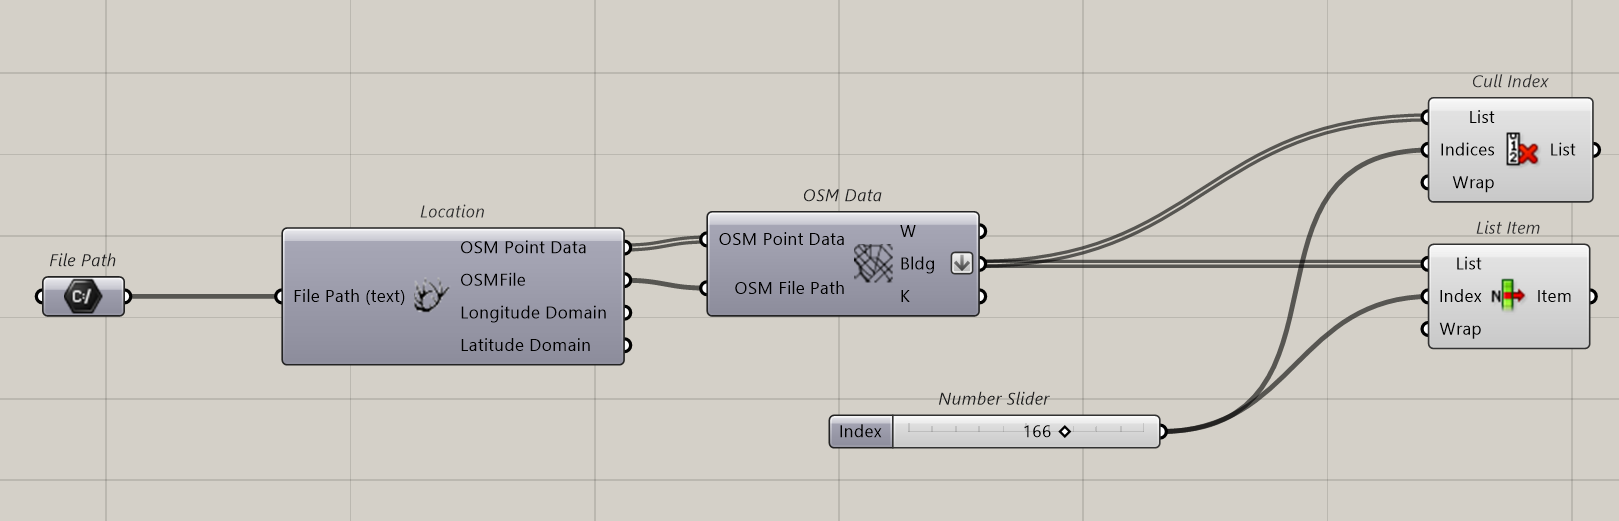
Flatten the building output. Add a list Item and identify the tower. Here it’s number 166
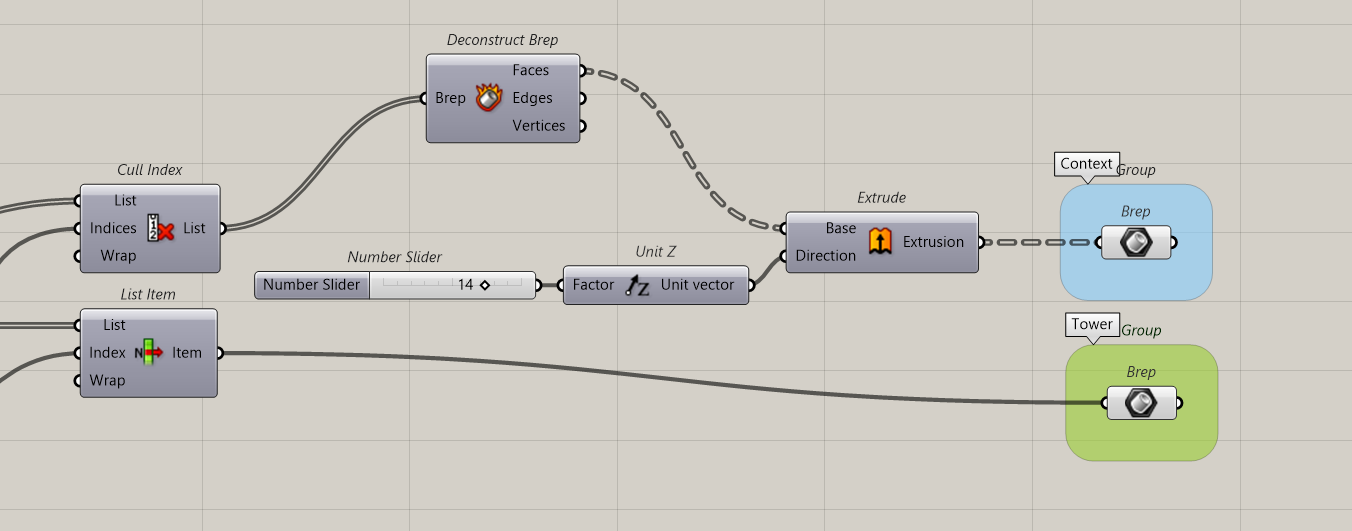
We will Cull the tower so that we will have on one side, the tower and on the other side all other buildings.
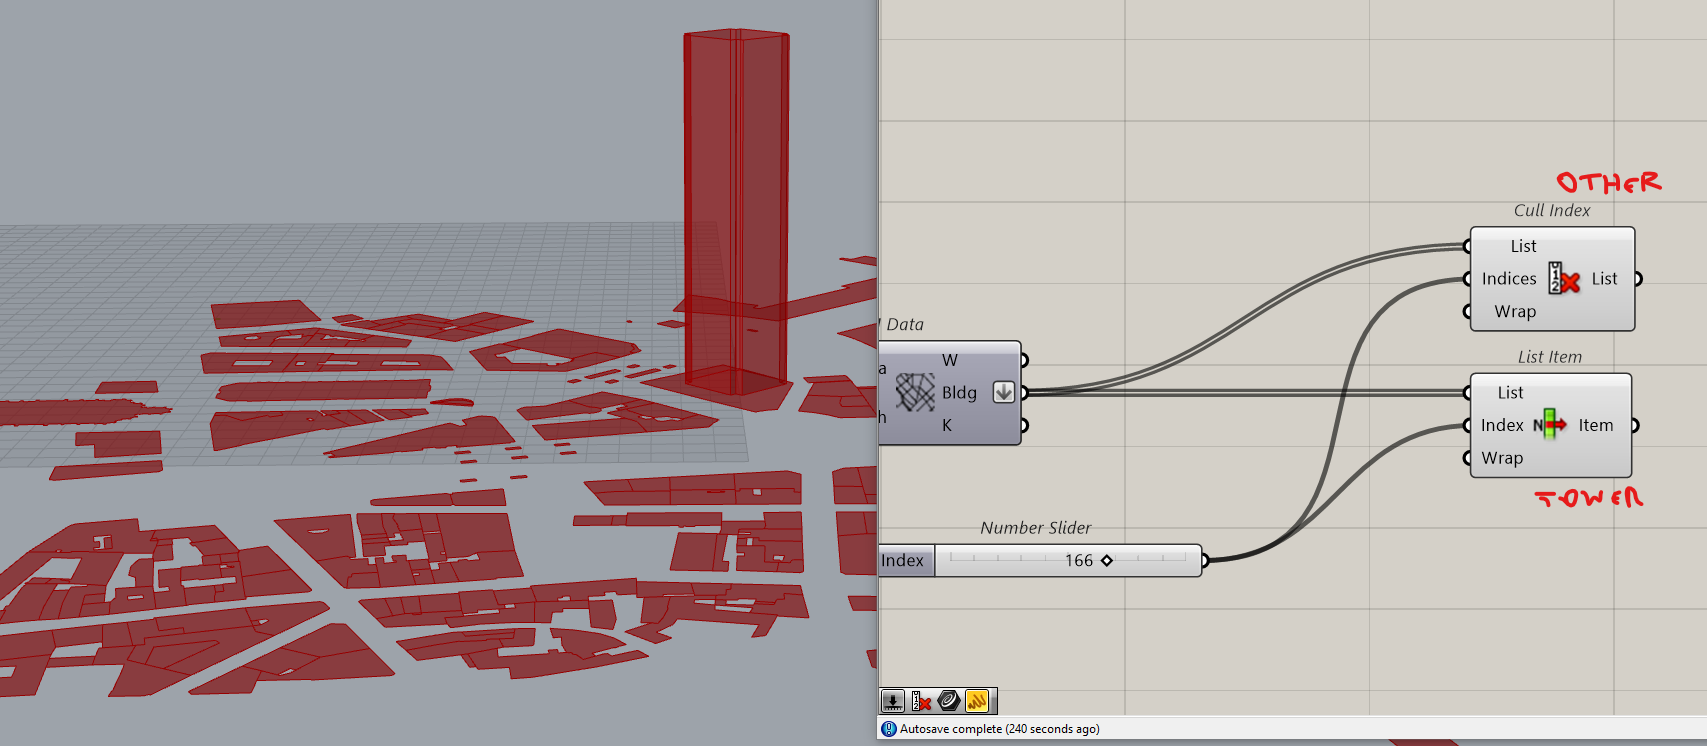
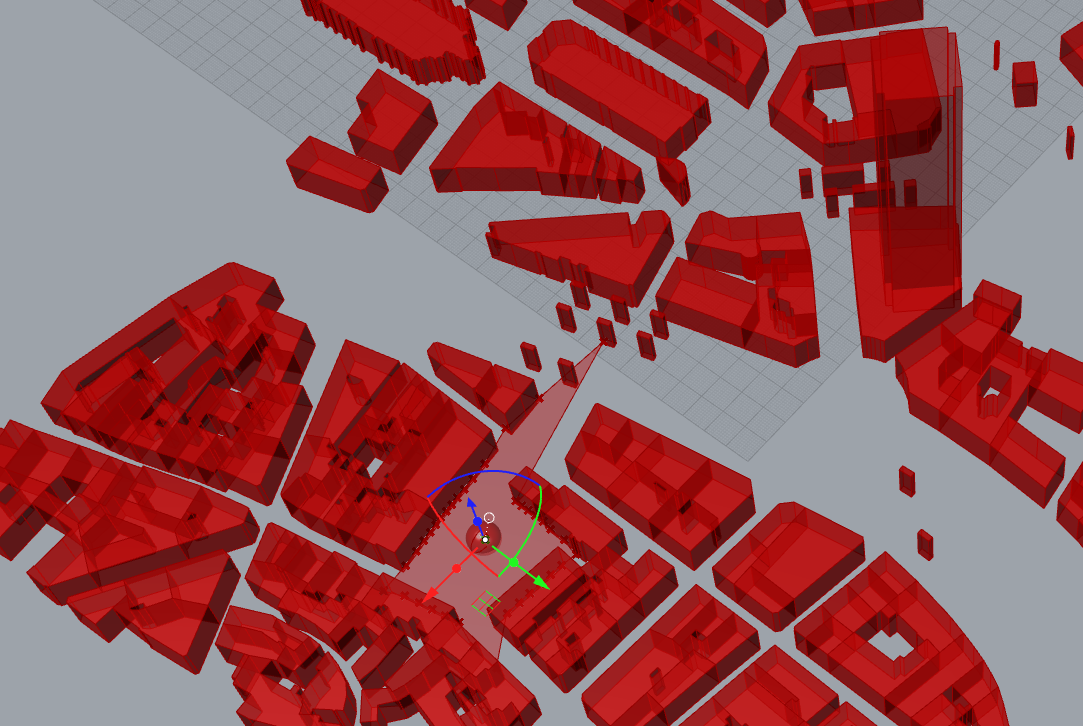
Extruding the buildings.
We will consider that all other heights are similar.
Ok the context is ready, we can start to study our Isovists.
2D Isovists for a single point
For more clarity, we organise our definition as this:
We this first the simple Isovist function which is Intersect slot, Mathematical collection
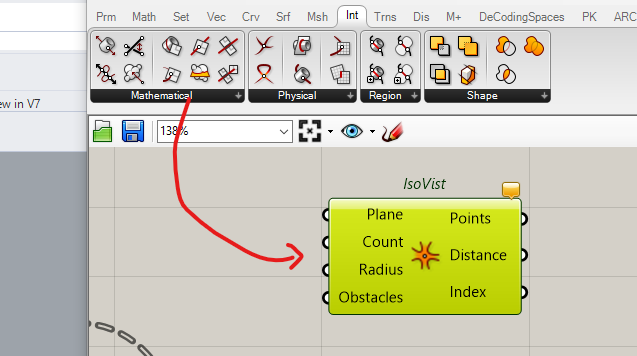
We create a point which is going to be the location from where we observe, Count is the number of Rays, radius, the max distance we observe.
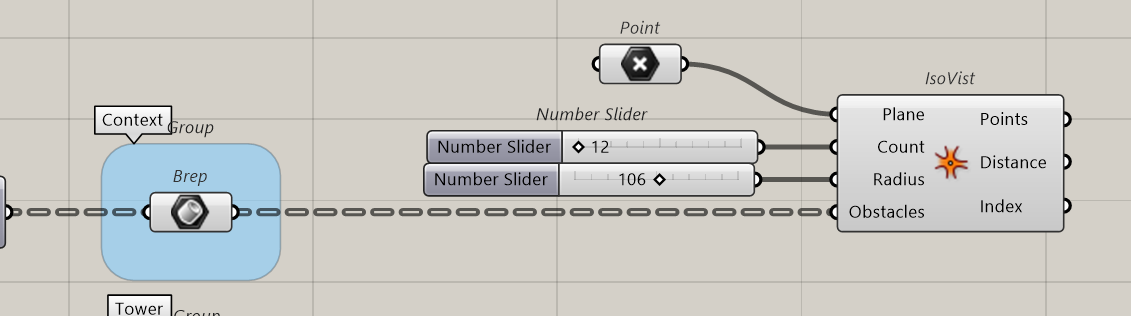
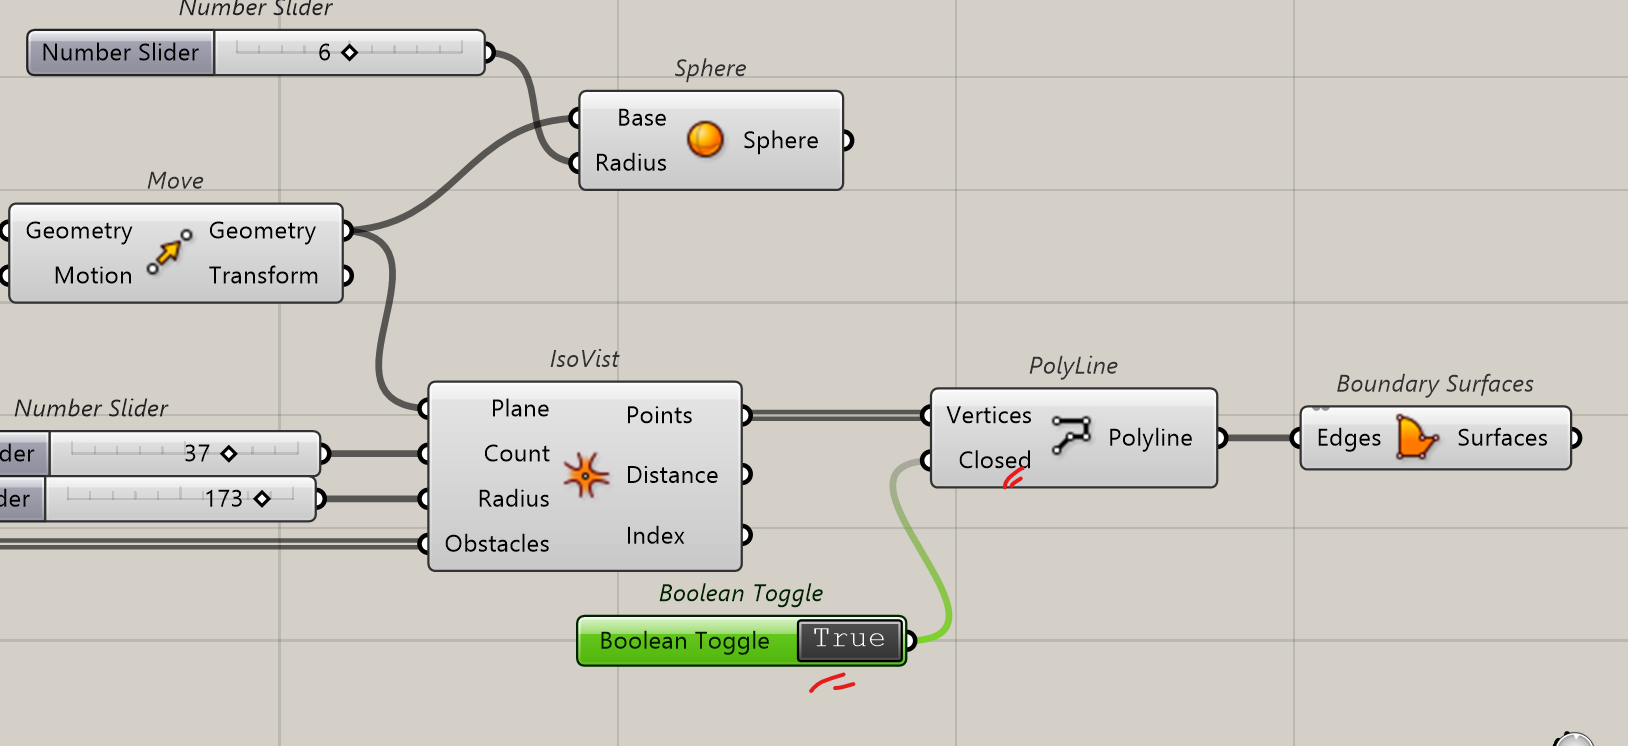
To visualise the results, we will create a geometry to connect all resulting points
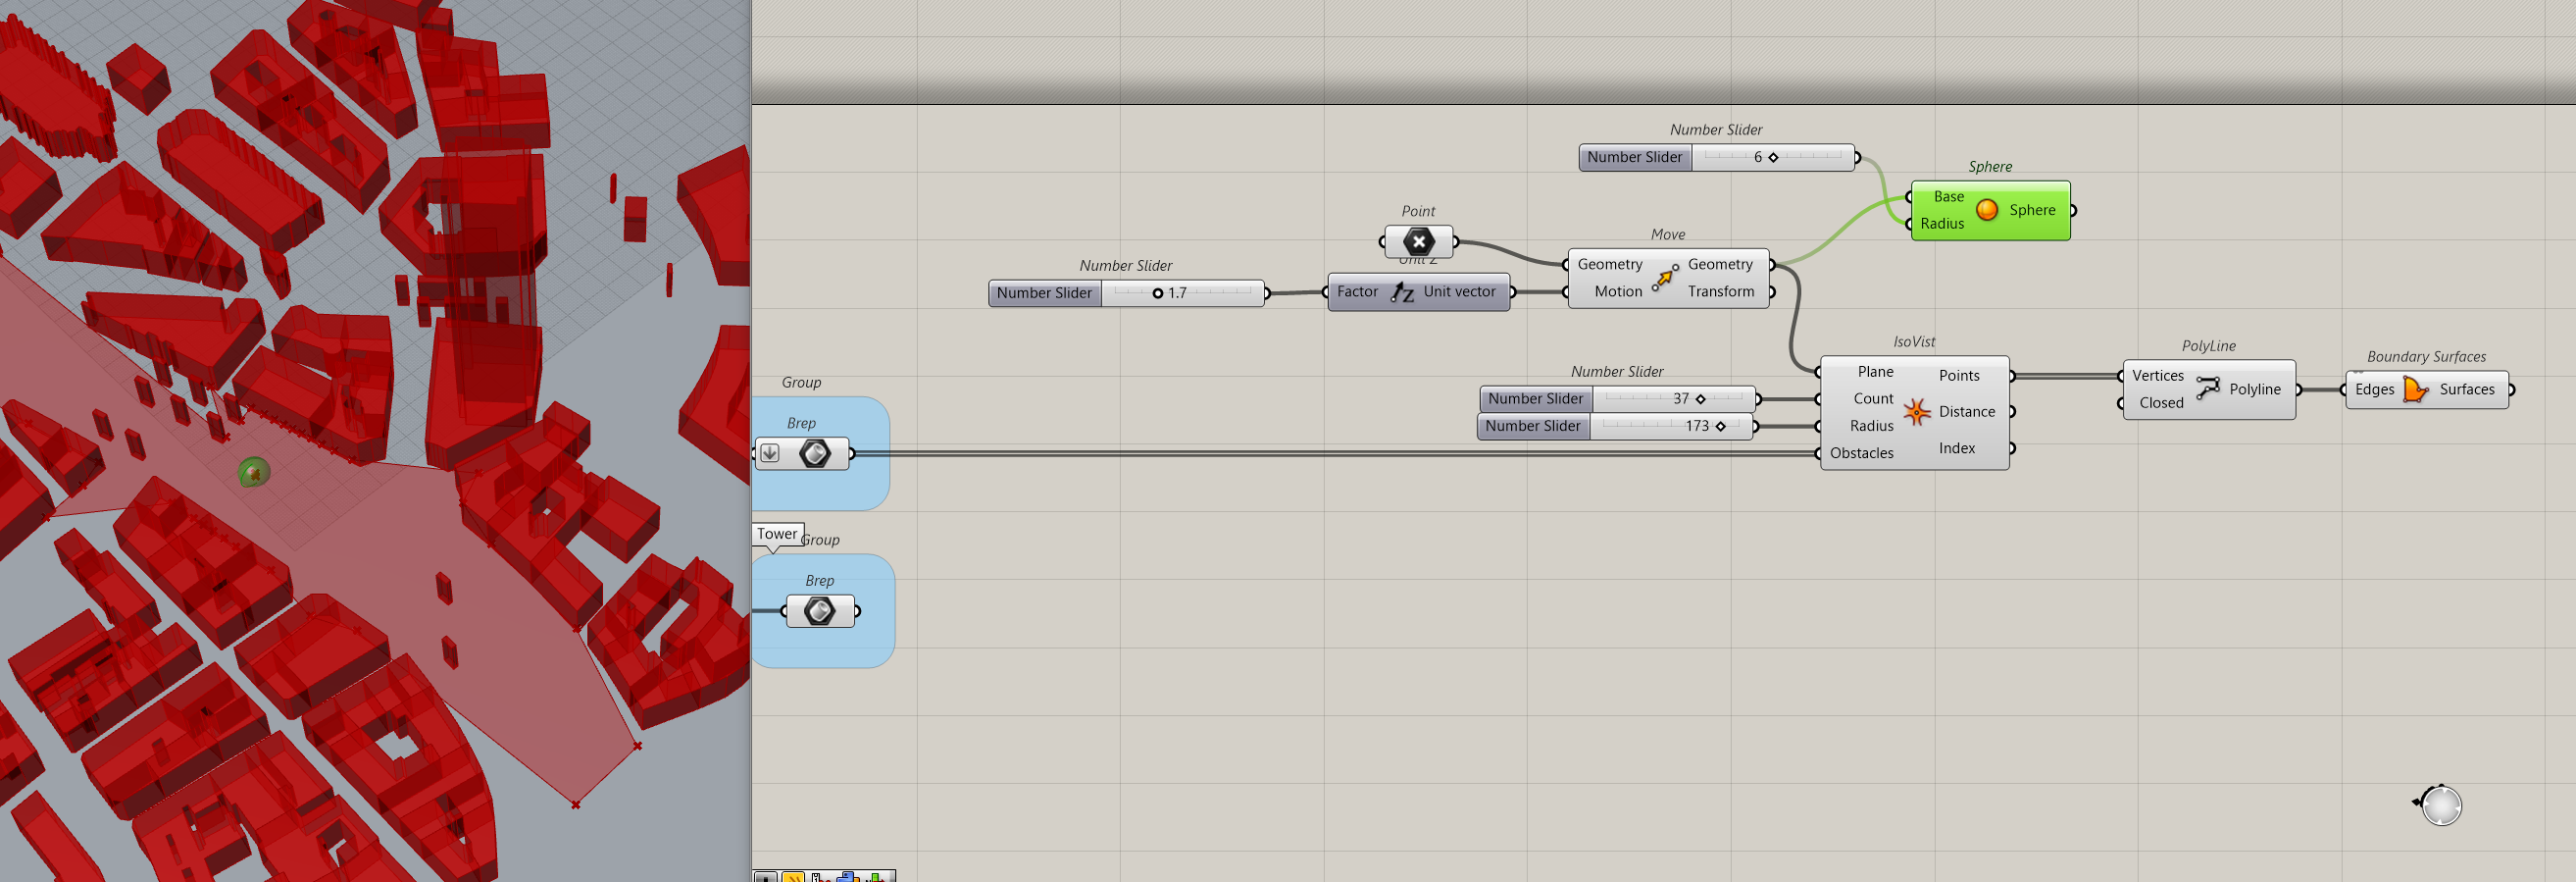
To better see the point, it is associated with a sphere (green in the image). A polyline connects all points. The polyline has to be closed. Then a surface can be done out of it.
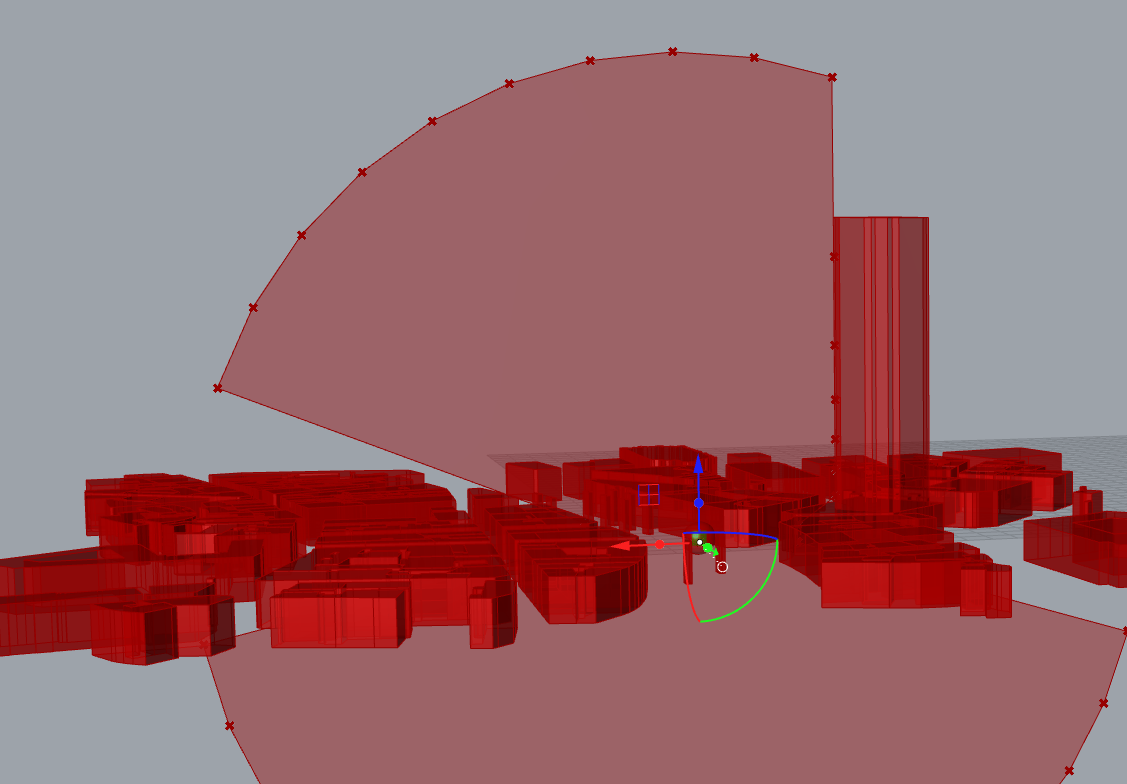
If we move our point we will see the different Isovists
It can also be used for cut sections
Just add a XZ plan or YZ plan or whatever vertical plane

We can exclude all points under the ground by a simple sorting process; any point that has a Z coordinate superior to 0 is kept.
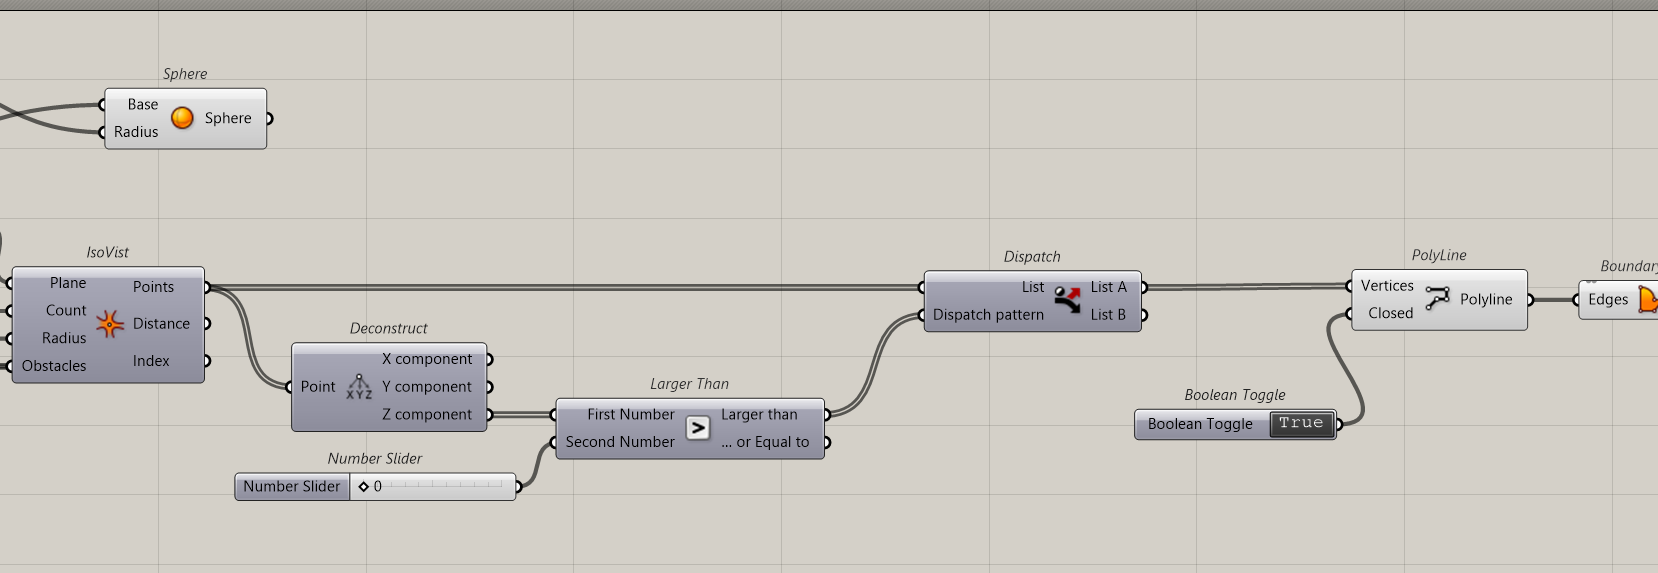
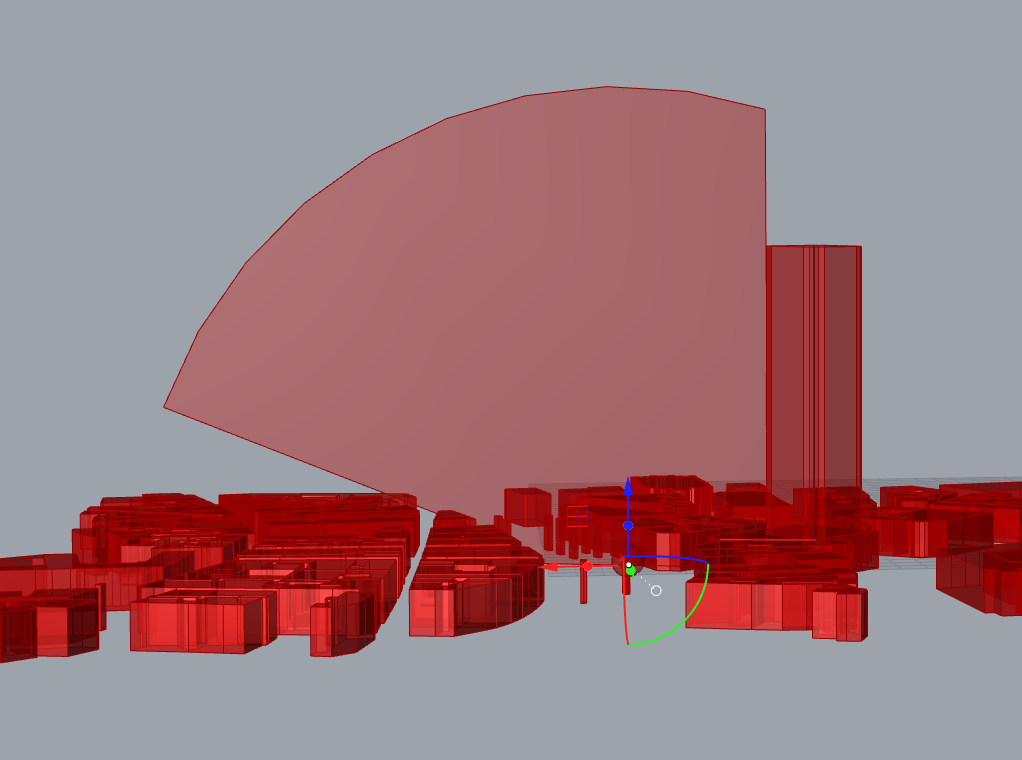
Better.
Evaluate this lesson par filling the survey HERE