Archives par mot-clé : Ladybug

Grasshopper, Urban Analysis, 2D Isovist

In this tutorial, the idea is to explore the potential of Isovist for urban analysis. Isovist is the surface or volume of space visible from a specific point. This concept has been proposed by Clifford Tandy in 1967 and then redefined by Michael Benedikt. Isovists are very useful to quantify the perception of urban spaces such as opening, closeness, and also useful to define urban envelopes. Isovists help to with non-intuitive solutions for complex problems.

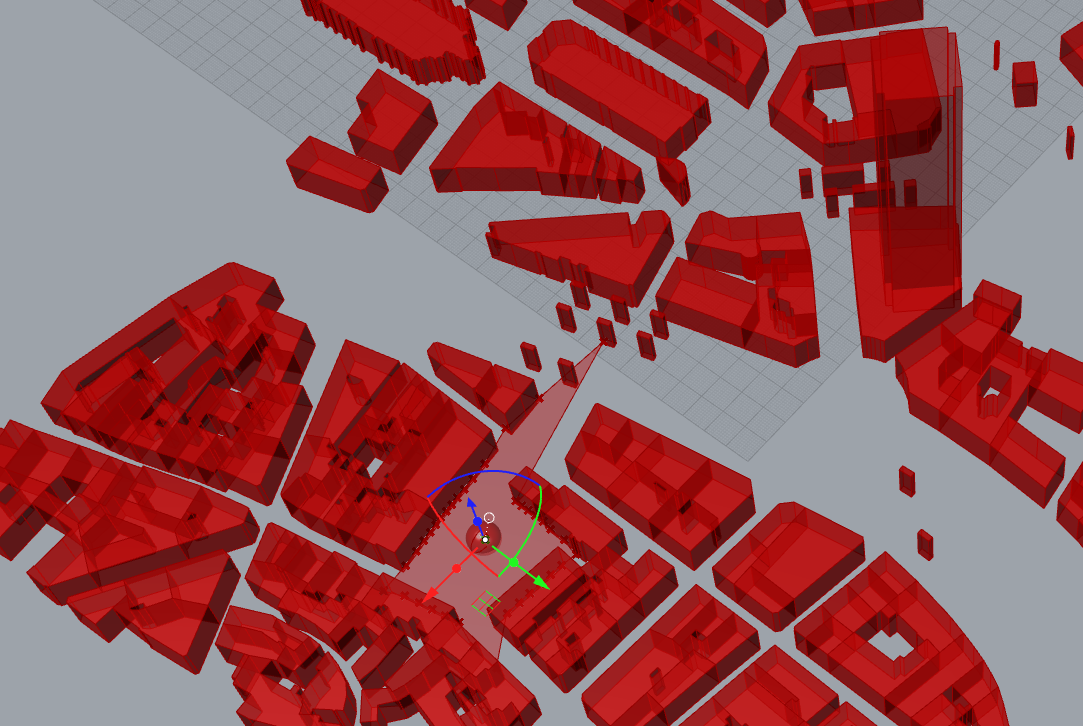
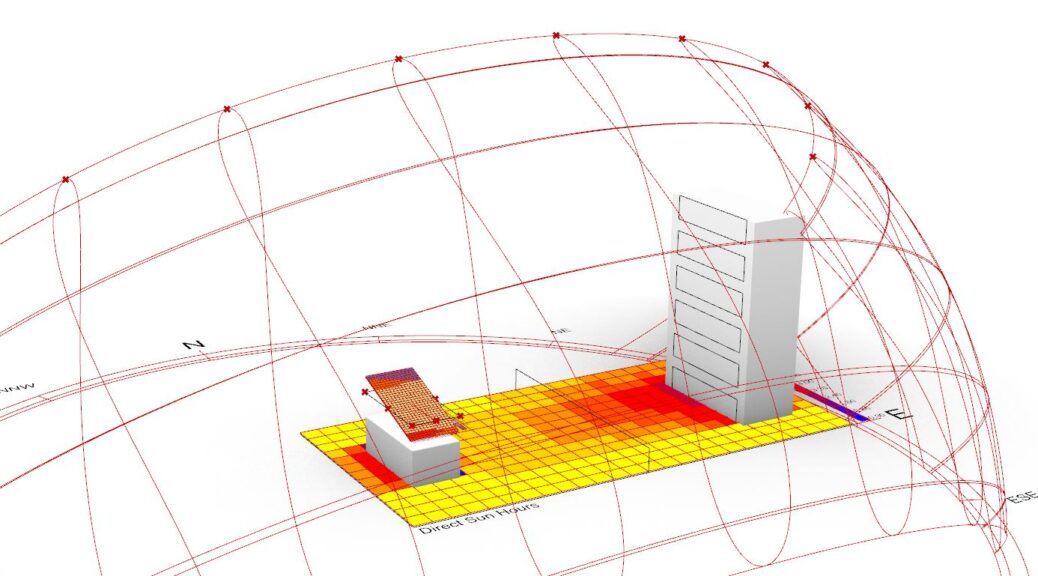
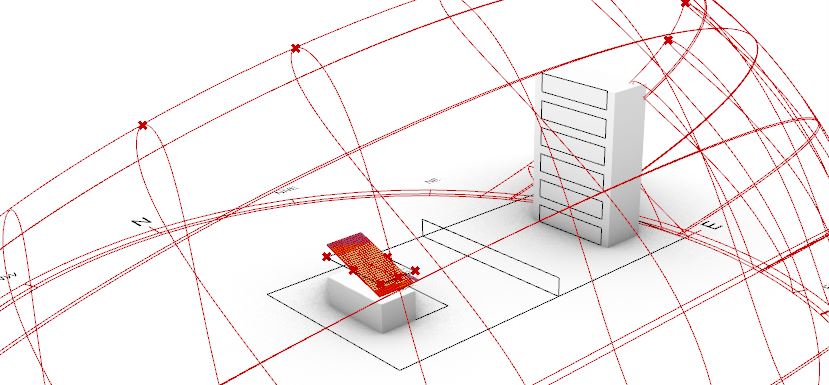
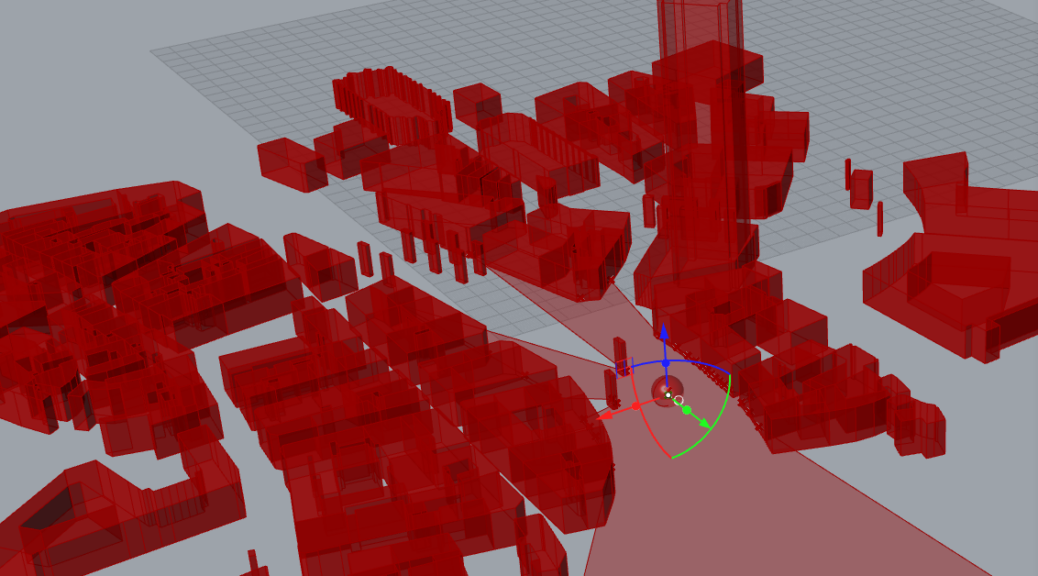
In this example, we will see how to set up an environment, then use a simple Isovist System, then a more complex one with Ladybug. Then we will see a non-intuitive question: where a very high tower can be seen in a dense urban context.

Let’s dive. Continuer la lecture de Grasshopper, Urban Analysis, 2D Isovist

Grasshopper LadyBug, solar panels

This is a quick set up to understand how to orient solar panels for maximum efficiency using Galapagos’ generative capacities.

Load EPW file from https://www.ladybug.tools/epwmap/

Use FilePath to get the file from where it has been stored.

Connect the SunPath

We add a date, to start it will be a single date, but we will work a period a time afterwards.

We evaluate Direct Sun hours

Geometry is the surface to be calculated, Context refers so objects casting Shadows

Connections

We run

This is the result for a single day June, the 21st at 10 am

Now we check for the same day from 6am to 6pm

And we have quantities. For every square of the grid, a total of direct sun hours

The have the total we can have a Mass addition

Adding a solar panel

We will search which orientation is best for a solar panel. To get faster results, we will only test two orientations

We add the LB Incident Radiation Component and its dependences

A Solar Panel is created, and we will git it the possibility to rotate X axes and then Y axes to find the better orientation

This is the solar panel

This how we can prepare the rotations

To go faster, we will investagate every 5° between -90 to +90. For that we prepare the slider as shown below. 18*5=90. So we go from -18 to +18 by 5

The Solar Panel becomes the new geometry, the grid has to be reduced, we try every 0.25m

We test for one day, one orientation

Ok, for one day, let test the best orientation

We add Galapagos component. Genome goes to the Slider and Fitness to the mass addition number obtained from the results.

Double click on Galapagos, we choose Maximize, because we are searching for the best result

Then Solvers, start Solvers

As our ground is pretty free from constructions, with no surprise, the best orientation here is horizontal (and we’re in June !!)

Other orientation…Facing south the best orientation is 20°

Please evaluate this lesson par filling the survey HERE