This tutorial aims to facilitate the creation of a solar path, ensuring accurate determination of the sun’s position, orientation, and altitude. This precision is invaluable for architectural design, enabling architects to optimize building orientations for solar efficiency. Additionally, it serves as a tool for verifying the solar orientation of heritage sites.
This approach enables the precise tracing of solar paths and orientations throughout history. Various software tools and methods exist to determine the position of the sun at any point in the past, making it particularly valuable for archeoastronomy purposes.
We will use Beegraphy, the online Grasshopper for that.
Is this tutorial we will learn how to
- Retrieve environmental data
- Create a list and convert string to text, degrees to radians
- Convert polar coordinates to Cartesian coordinates
- Construct la curve by interpolating points
- Create and place a text
- Create a sequence to have a print a series of numbers at a specific location
- Create a loft and add colours
- Edit groups and component for further public use
- Testing a small simulation.
Disclamer.
Why taking Beegraphy when many software could do that almost automatically?
Relying solely on software doesn’t necessarily foster a deep understanding of our subject matter. By recreating a solar system, we gain insights into its functioning and the reasons behind various phenomena we observe. This process allows us to scrutinize, verify, and validate the information at our disposal. Additionally, we have the freedom to chart our own path of inquiry and frequently unearth fresh, original concepts. It’s akin to selecting an image from a catalog versus crafting one’s own. While the former confines us within predetermined choices made by others, the latter empowers us to make independent decisions and conduct our own analyses.
BeeGraphy is an innovative cloud-based platform tailored for computational designers. It provides effortless cross-platform compatibility, removing the requirement for installations, thereby facilitating seamless usage on Windows, Mac, or Linux systems. By enabling model creation directly in the cloud and allowing easy sharing through a straightforward URL link, BeeGraphy fosters real-time collaboration and co-creation among individuals and teams. Beegraphy ensures that you can share your parametric models securely without disclosing the underlying script, empowering to present designs confidently. Additionally, Beegrapgy offers the opportunity to showcase and market models in Beegraphy online store, generating passive income.
Goal
The concept entails generating a solar trajectory based on coordinates. This method ensures accurate determination of the sun’s position regardless of location or time. Ultimately, a vector will be produced, originating from the sun and extending to a designated point. This vector aids in determining whether a sunbeam intersects a specific point or passes through a particular architectural structure.
Sources
Sun coordinates can be accessed from various websites, with SunEarthTools being a highly regarded resource. This platform enables users to calculate the altitude and azimuth coordinates of the sun at a specified location. https://www.sunearthtools.com/dp/tools/pos_sun.php?lang=en
For this example, I’ll take Erevan in Armenia. It’s an homage to Beegraphy developers. Don’t forget to type Execute whenever a change is made.
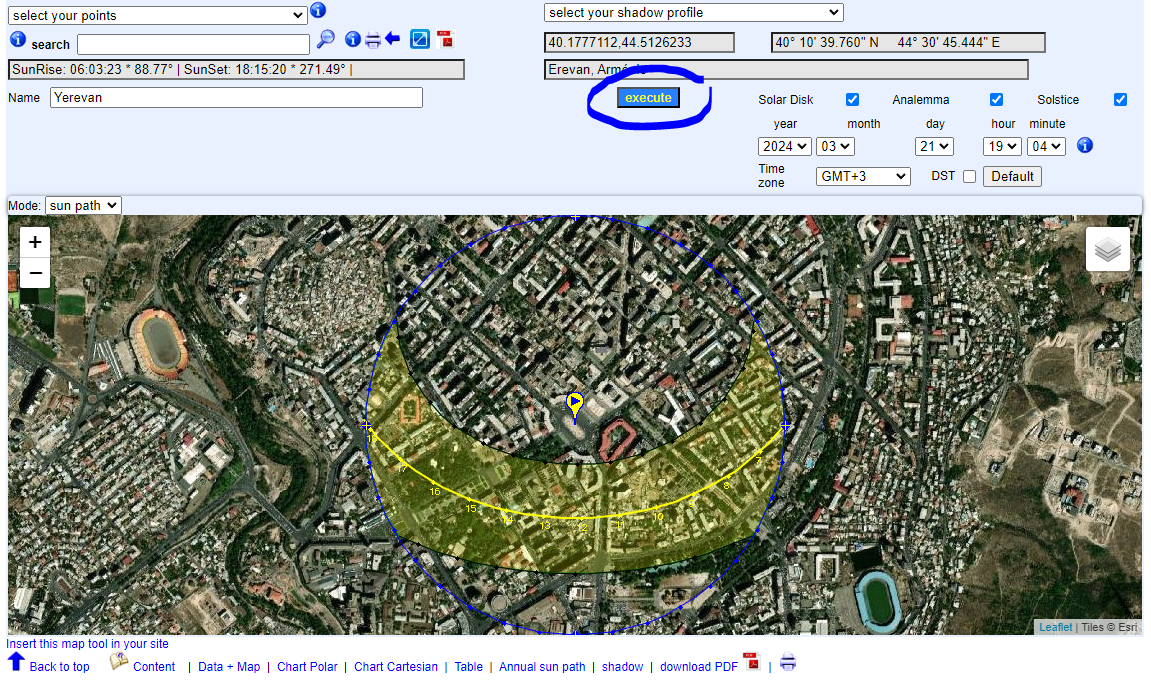
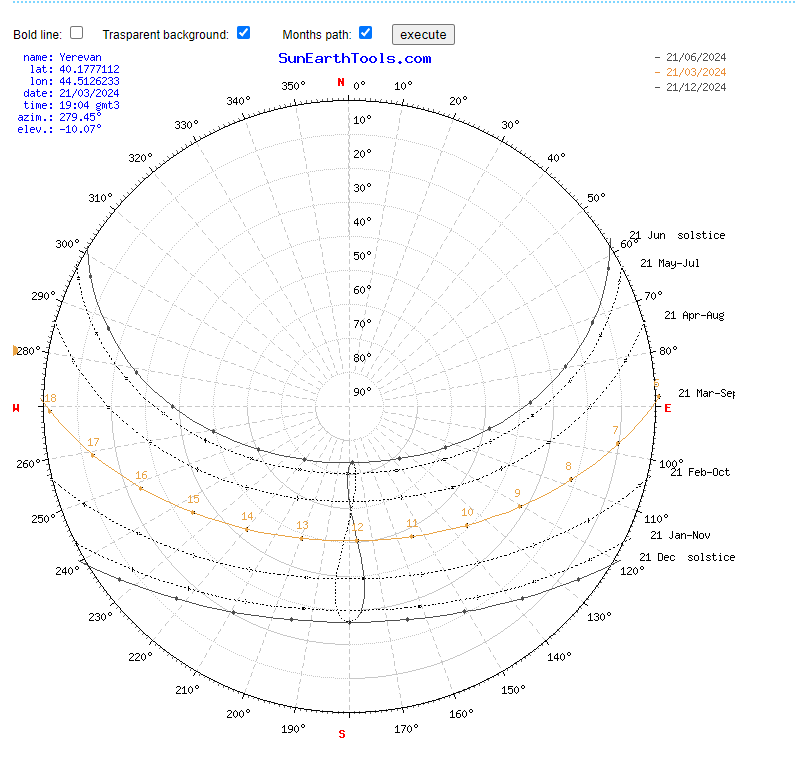
The site provides sun charts
Tables
| sun position |
Elevation | Azimuth | latitude | longitude |
| 21/03/2024 19:04 | GMT3 | -10.07° | 279.45° | 40.1777112° N | 44.5126233° E |
| twilight |
Sunrise | Sunset | Azimuth Sunrise | Azimuth Sunset |
| twilight -0.833° | 06:03:23 | 18:15:20 | 88.77° | 271.49° |
| Civil twilight -6° | 05:36:17 | 18:42:26 | 84.39° | 275.89° |
| Nautical twilight -12° | 05:04:34 | 19:14:14 | 79.13° | 281.17° |
| Astronomical twilight -18° | 04:32:17 | 19:46:38 | 73.54° | 286.81° |
| daylight |
hh:mm:ss | diff. dd+1 | diff. dd-1 | Noon |
| 21/03/2024 | 12:11:57 | 00:02:40 | -00:02:39 | 12:09:21 |
What we are looking for is this list of coordinates showing Elevation and Azimuth.
| Date: | 21/03/2024 | GMT3 | |
| coordinates: | 40.1777112, 44.5126233 | |
| location: | Erevan, Arménie | |
| hour | Elevation | Azimuth |
| 06:03:23 | -0.833° | 88.77° |
| 7:00:00 | 9.96° | 97.97° |
| 8:00:00 | 21.12° | 108.4° |
| 9:00:00 | 31.57° | 120.45° |
| 10:00:00 | 40.64° | 135.3° |
| 11:00:00 | 47.31° | 154.05° |
| 12:00:00 | 50.26° | 176.47° |
| 13:00:00 | 48.67° | 199.52° |
| 14:00:00 | 43.01° | 219.55° |
| 15:00:00 | 34.55° | 235.5° |
| 16:00:00 | 24.45° | 248.29° |
| 17:00:00 | 13.47° | 259.12° |
| 18:00:00 | 2.09° | 269.01° |
| 18:15:20 | -0.833° | 271.49° |
Ok just to be clear (https://drajmarsh.bitbucket.io/sunpath3d.html)
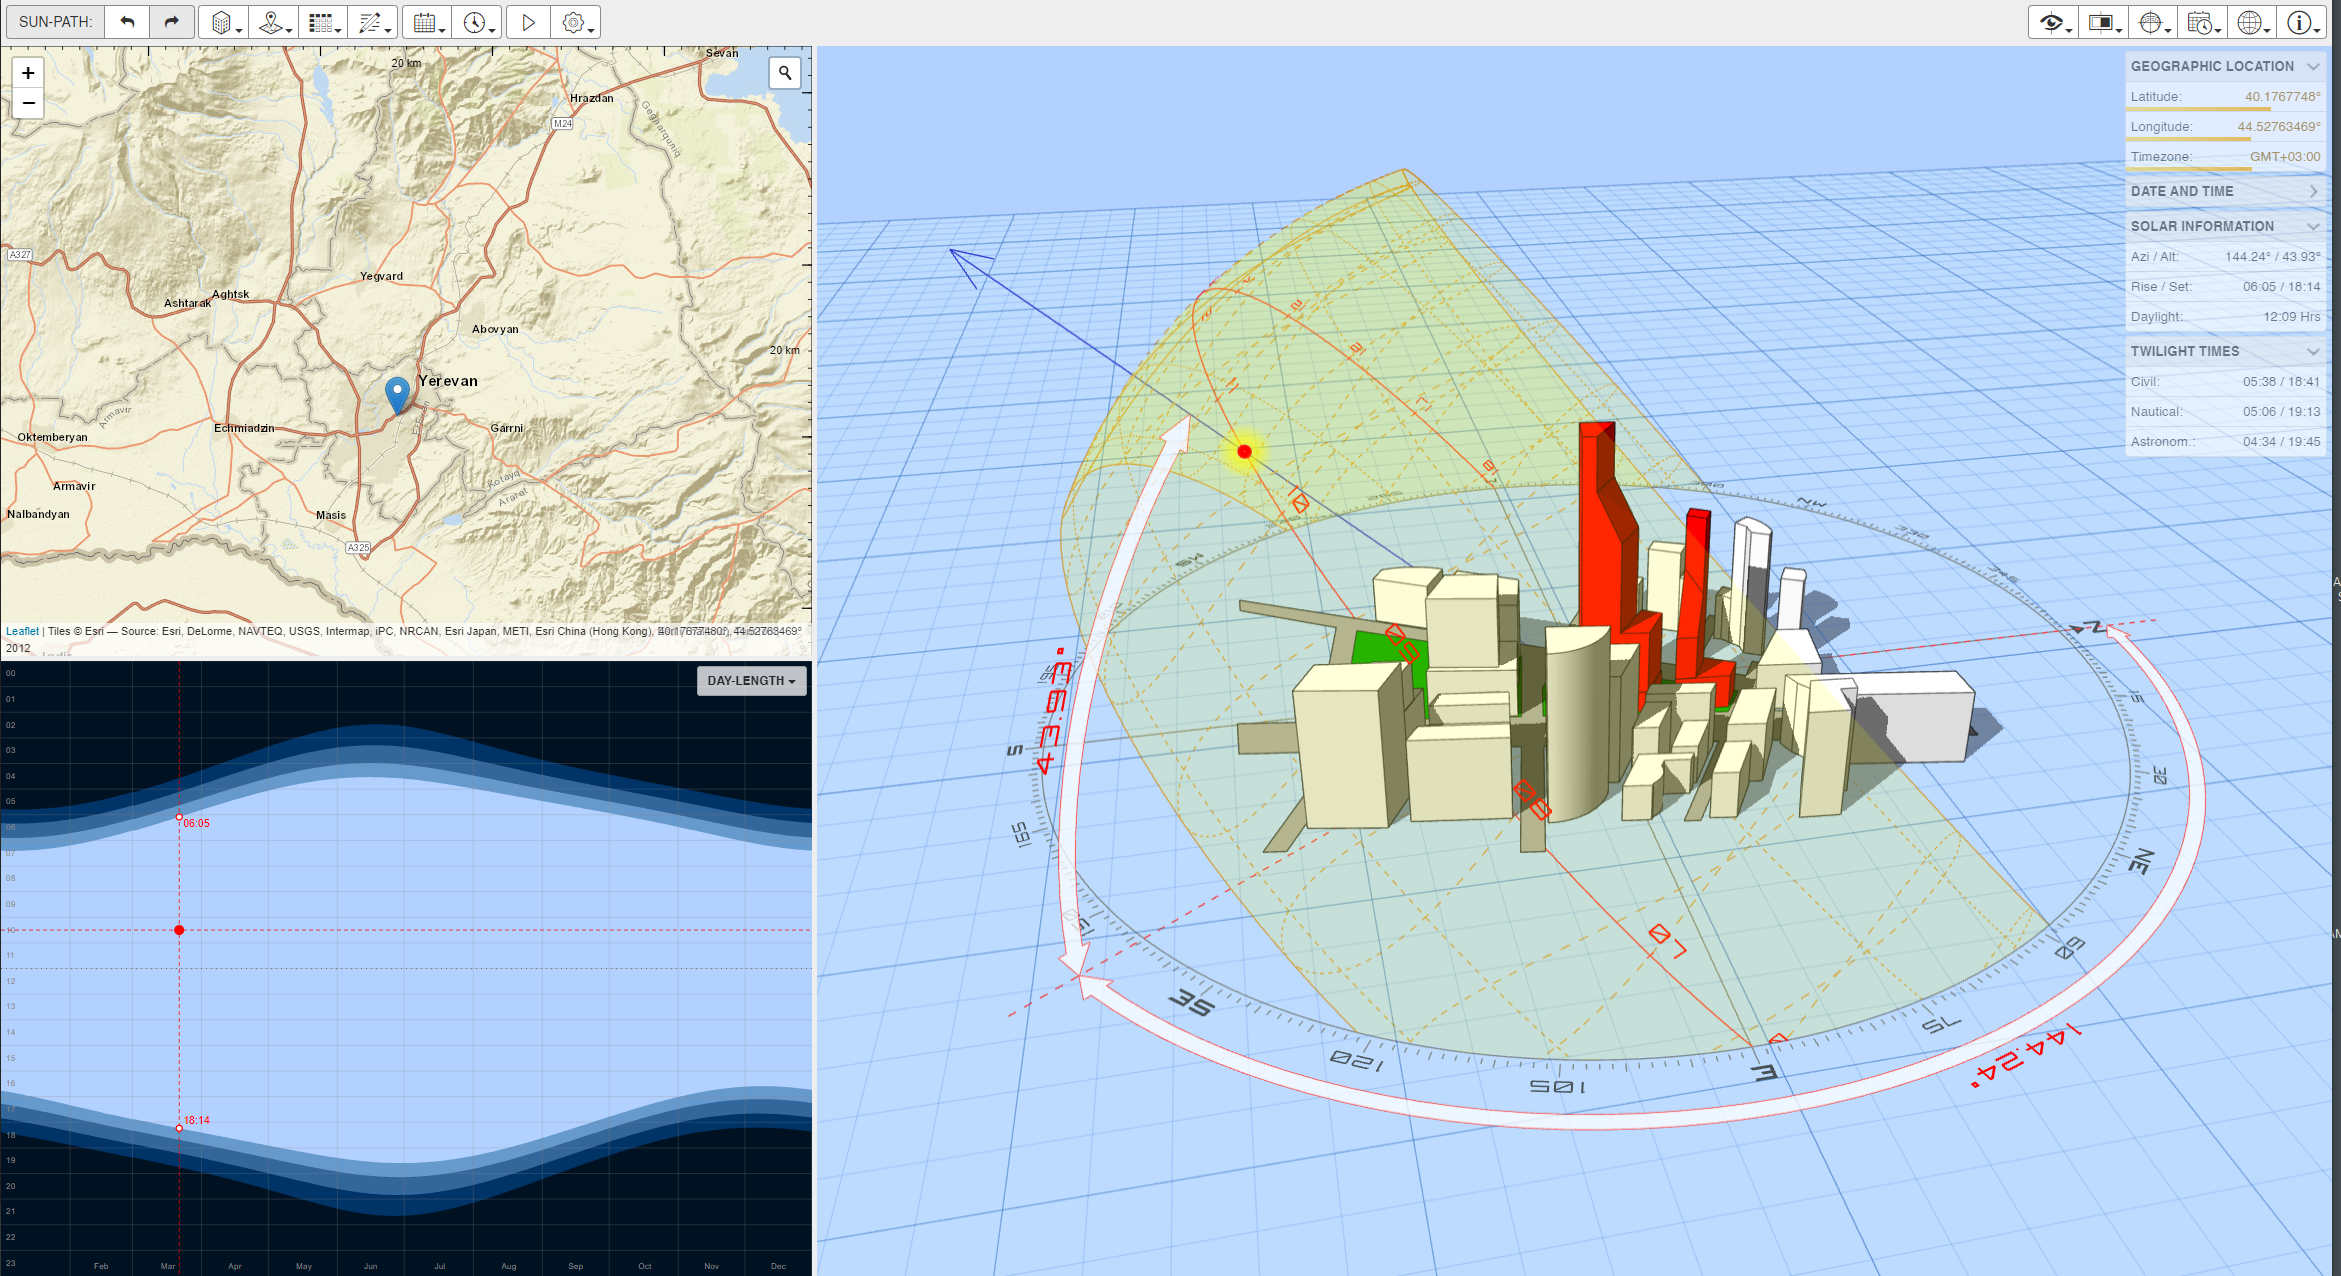
ELEVATION / AZIMUTH
Elevation is the angle from the ground to the sun, Azimuth is the angle from North Direction to the projection of the sun on the ground. The elevation is the vertical angular distance between a celestial body (sun, moon) and the observer’s local horizon or, also called, the observer’s local plane. The azimuth is the angle between North, measured clockwise around the observer’s horizon, and a celestial body (sun, moon).
https://beegraphy.com/embed/65f726a0a7b1d571f05d0a8d
Using the data
Copy the Elevation Data from SunEarthTools and paste them in a Testbox in Beegraphy. Erase the ° sigh which would create mistakes.
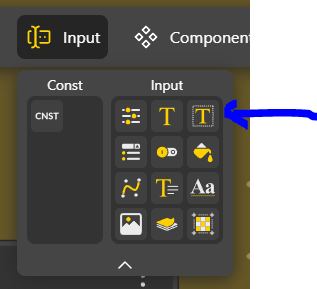 Text Area Input
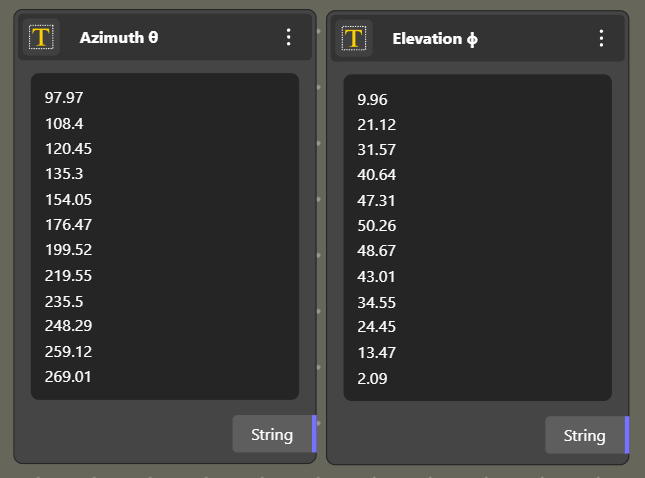
To use those numbers which are now considered as text, to real numbers. We also need to use those numbers, one by one. It’s two things to do.
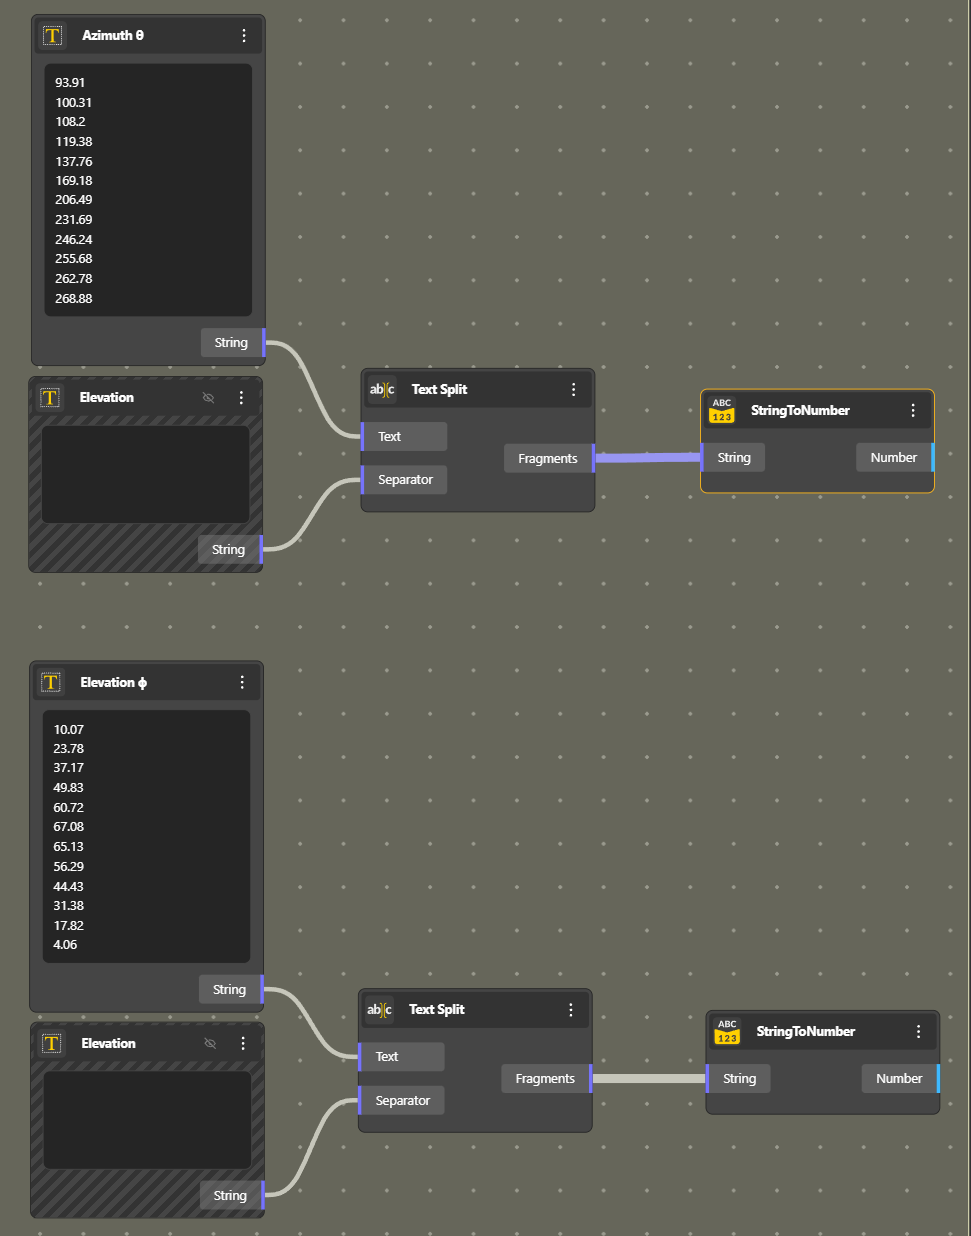
We can verify that the Text Area Input create a long line of numbers
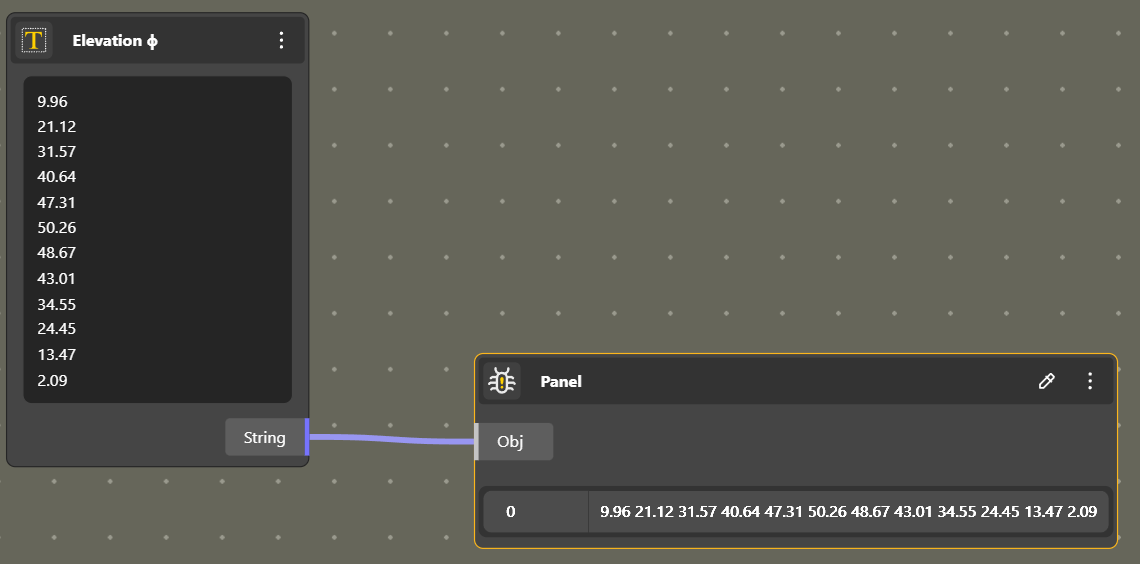
We need a list.
For that, we will create a break after each number. We add an empty Text Area Input, click Enter in it and we connect the whole to Text Split. Here we go. We have a list.
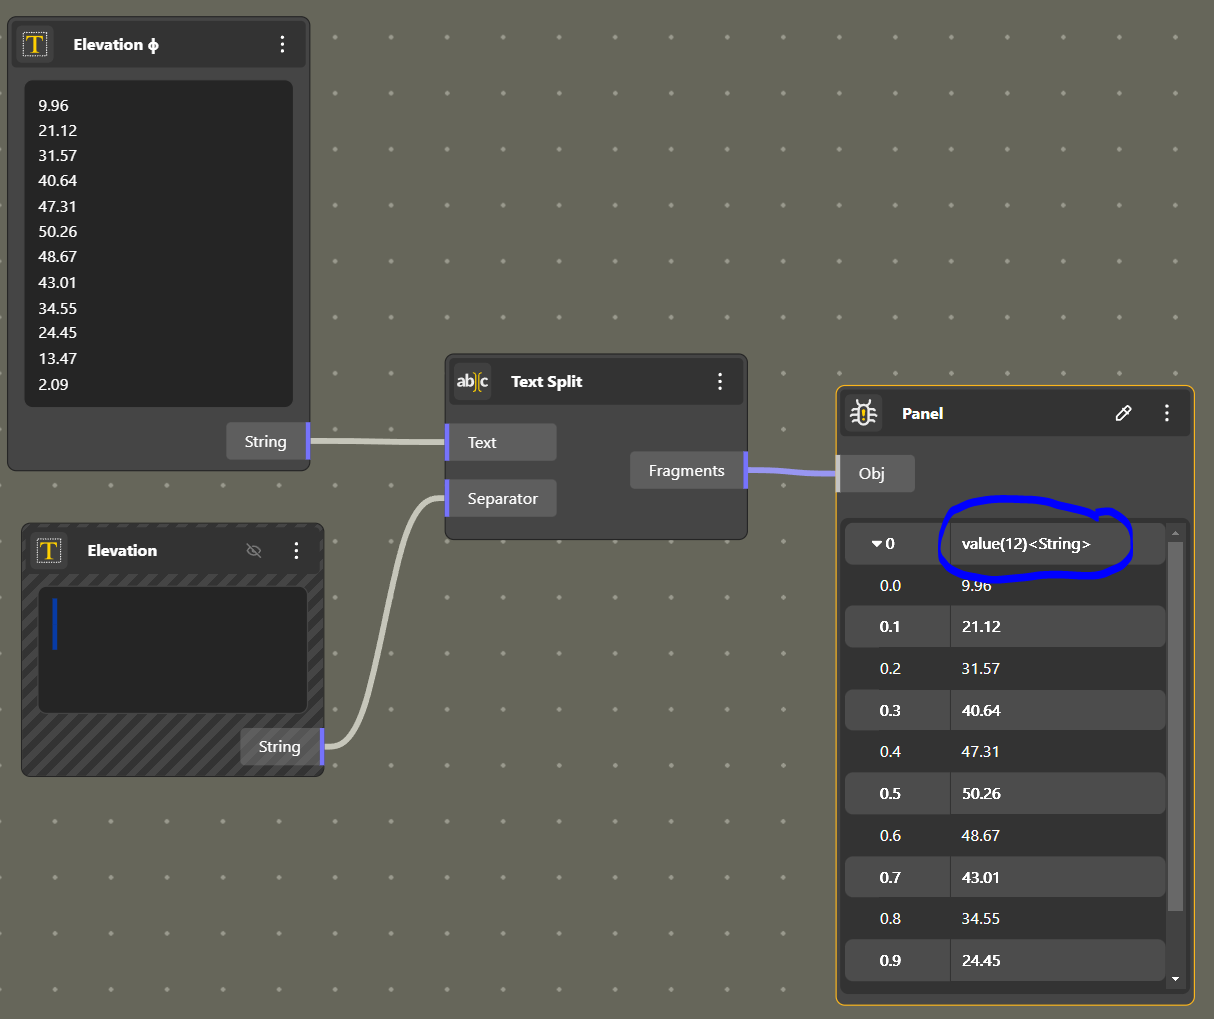
Ok, but the list is still a String list, meaning it’s not seen as numbers, but as words. Let’s convert using a String to Numbers component.
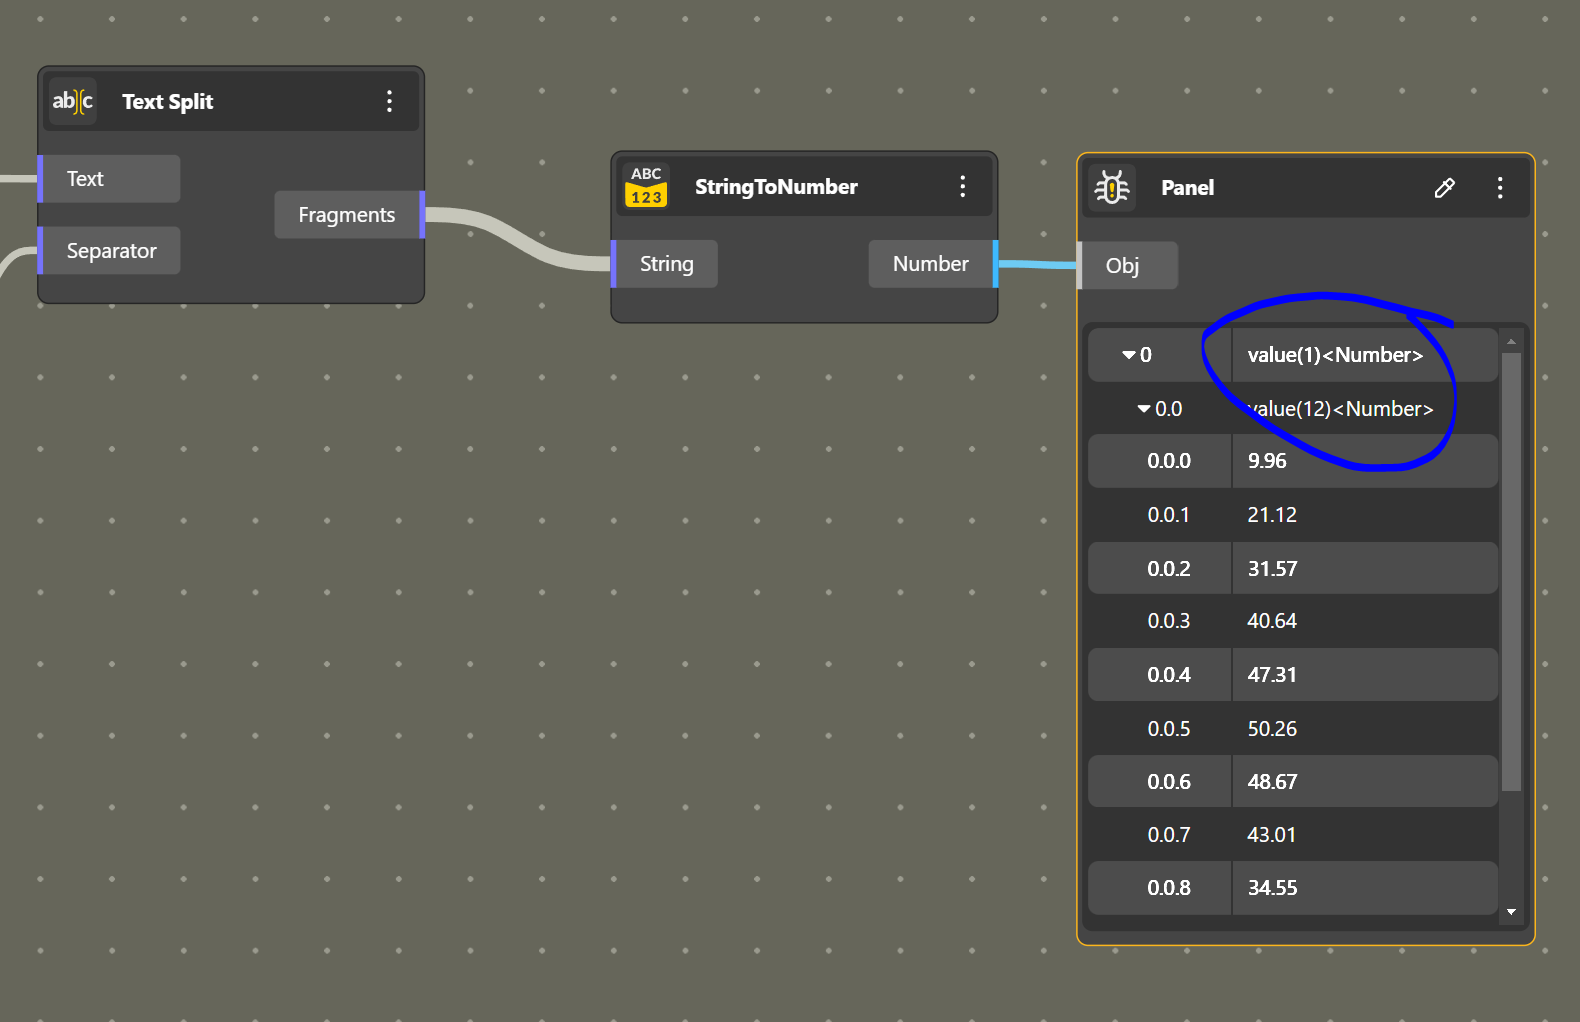
Ok we see the difference. We now have numbers.
We’ll do the same with the Azimuth Data
This is the expected result, with Elevation and Azimuth
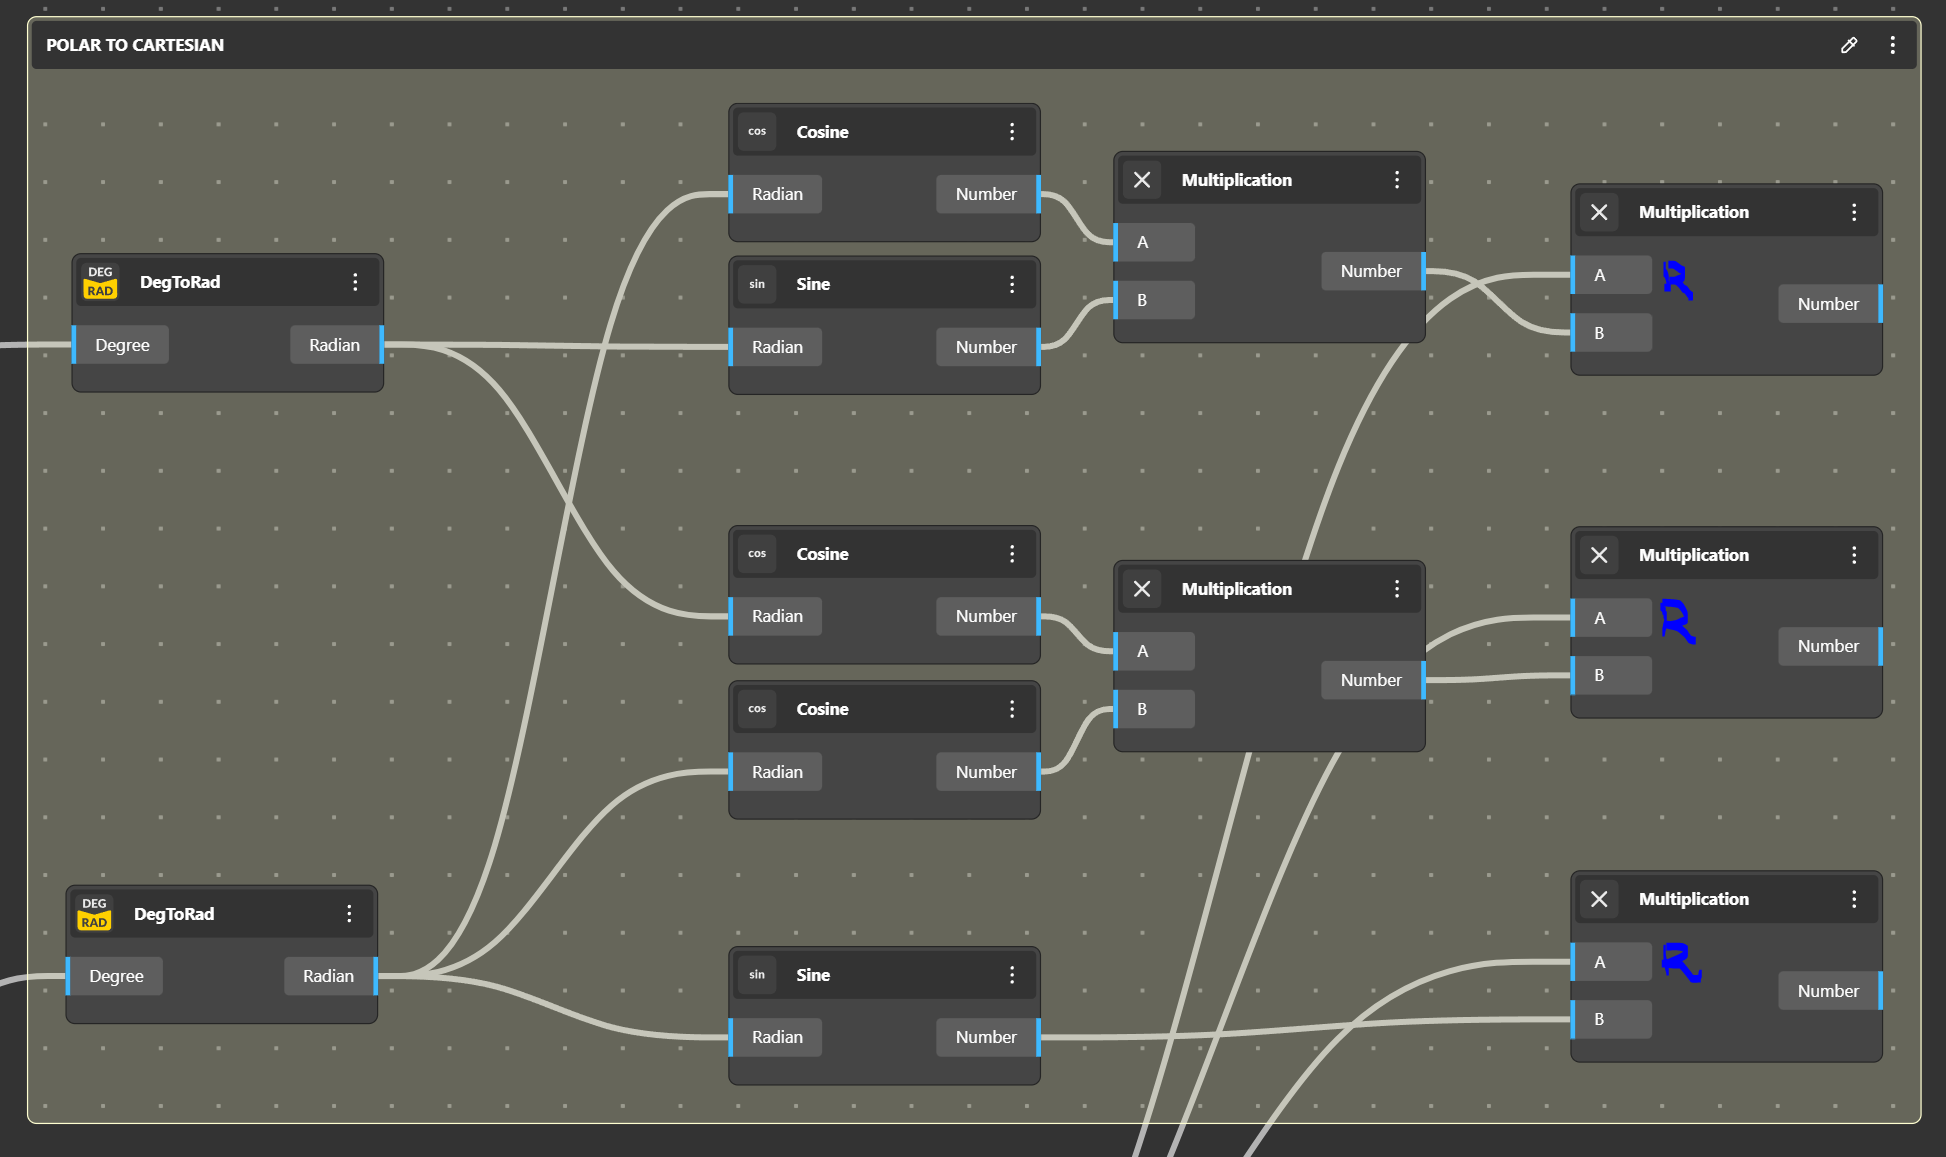
Converting Azimuth and Elevation to XYZ Coordinates.
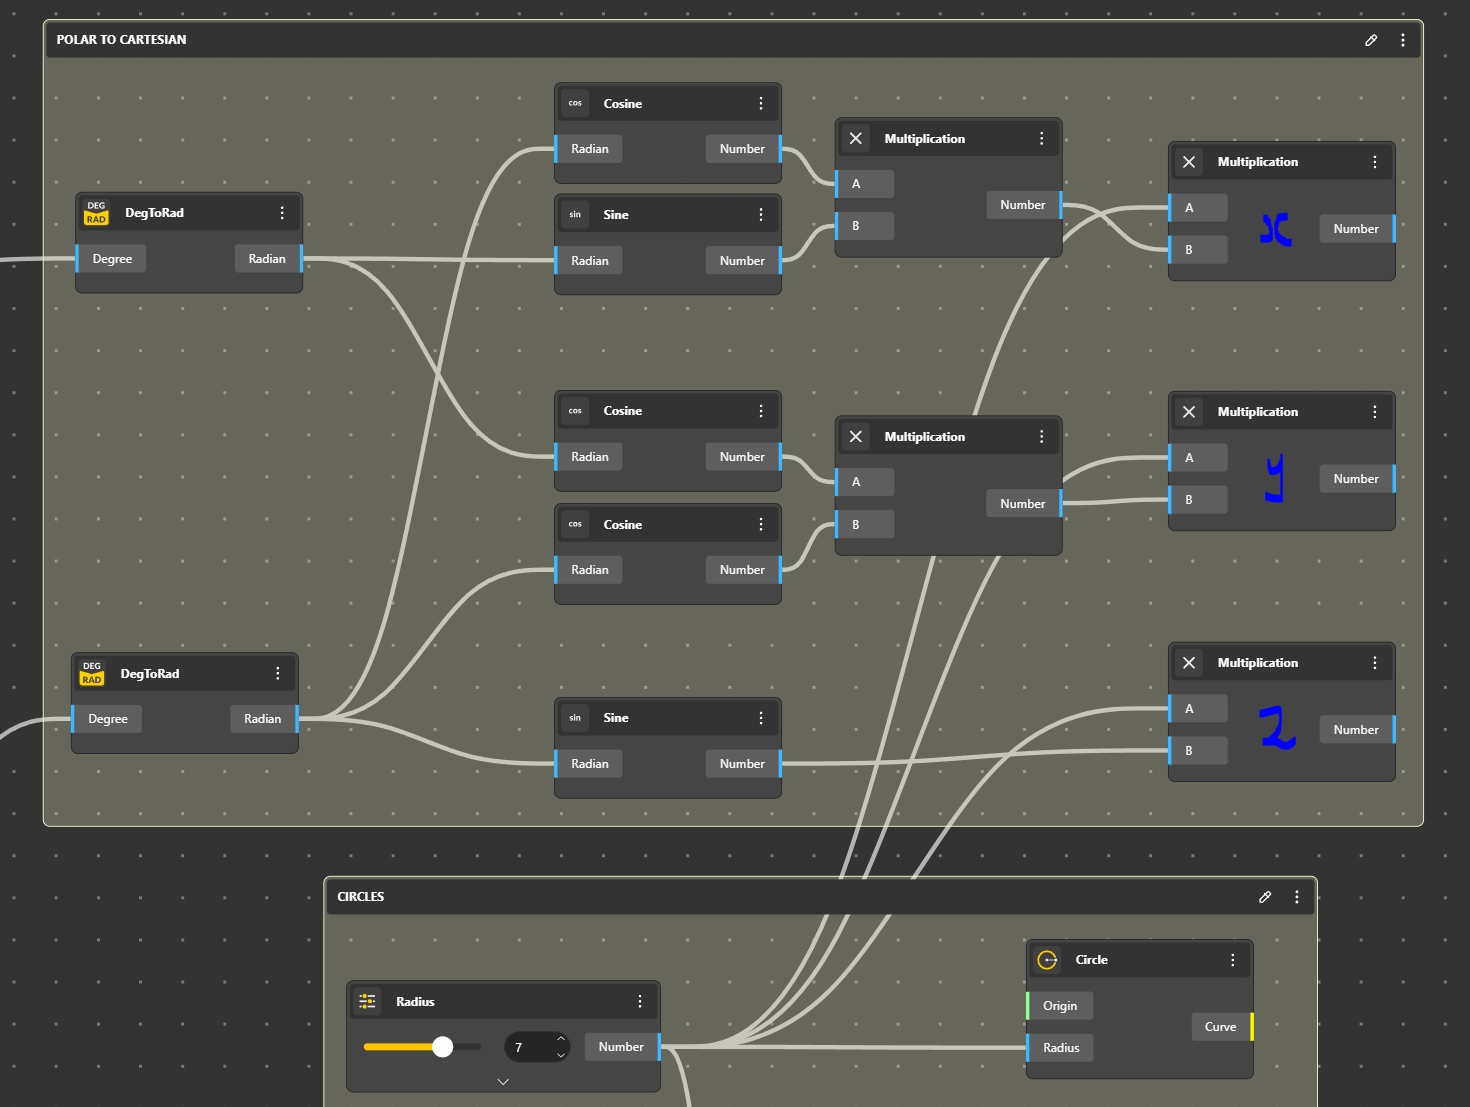
Now we have to convert our polar coordinates to XYZ coordinates? For this we will use this Formula
x = R * cos(ϕ) * sin(θ)
y = R * cos(ϕ) * cos(θ)
z = R * sin(ϕ)
Where R is the distance of the point from the origin, θ (the azimuth), and ϕ (the elevation)
We see that we have our angles in degrees and we need to use Radians. One more little conversion.
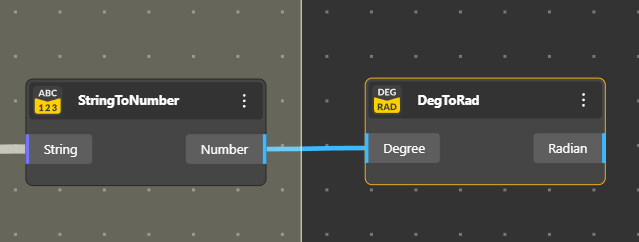
We do that for both outputs
In the Formula R is a circle Radius. So we need a circle. Let’s create one and we will define the Radius with a Range Input to be able to change the values.
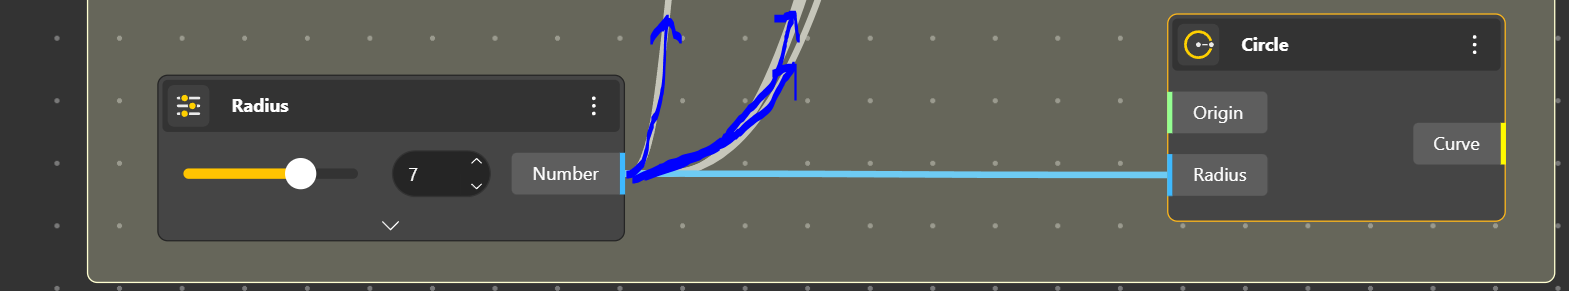
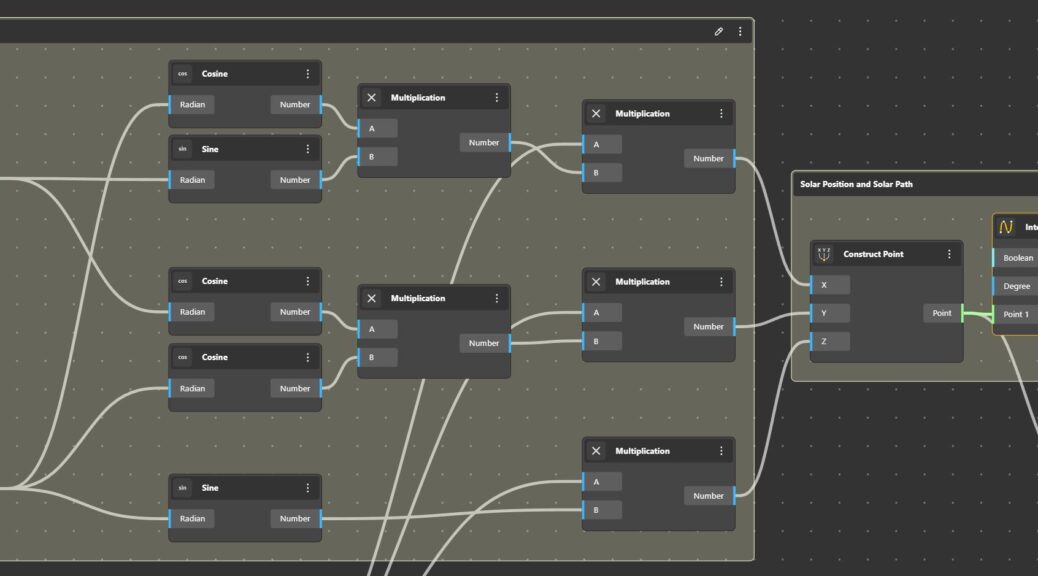
Now it’s just a matter of connecting our values to SIN and COS
This is the final assemblage. The R mark indicates that it is connected to the Circle Radius
Now we connect a Construct Point to have our solar positions from which we can have the Solar Path
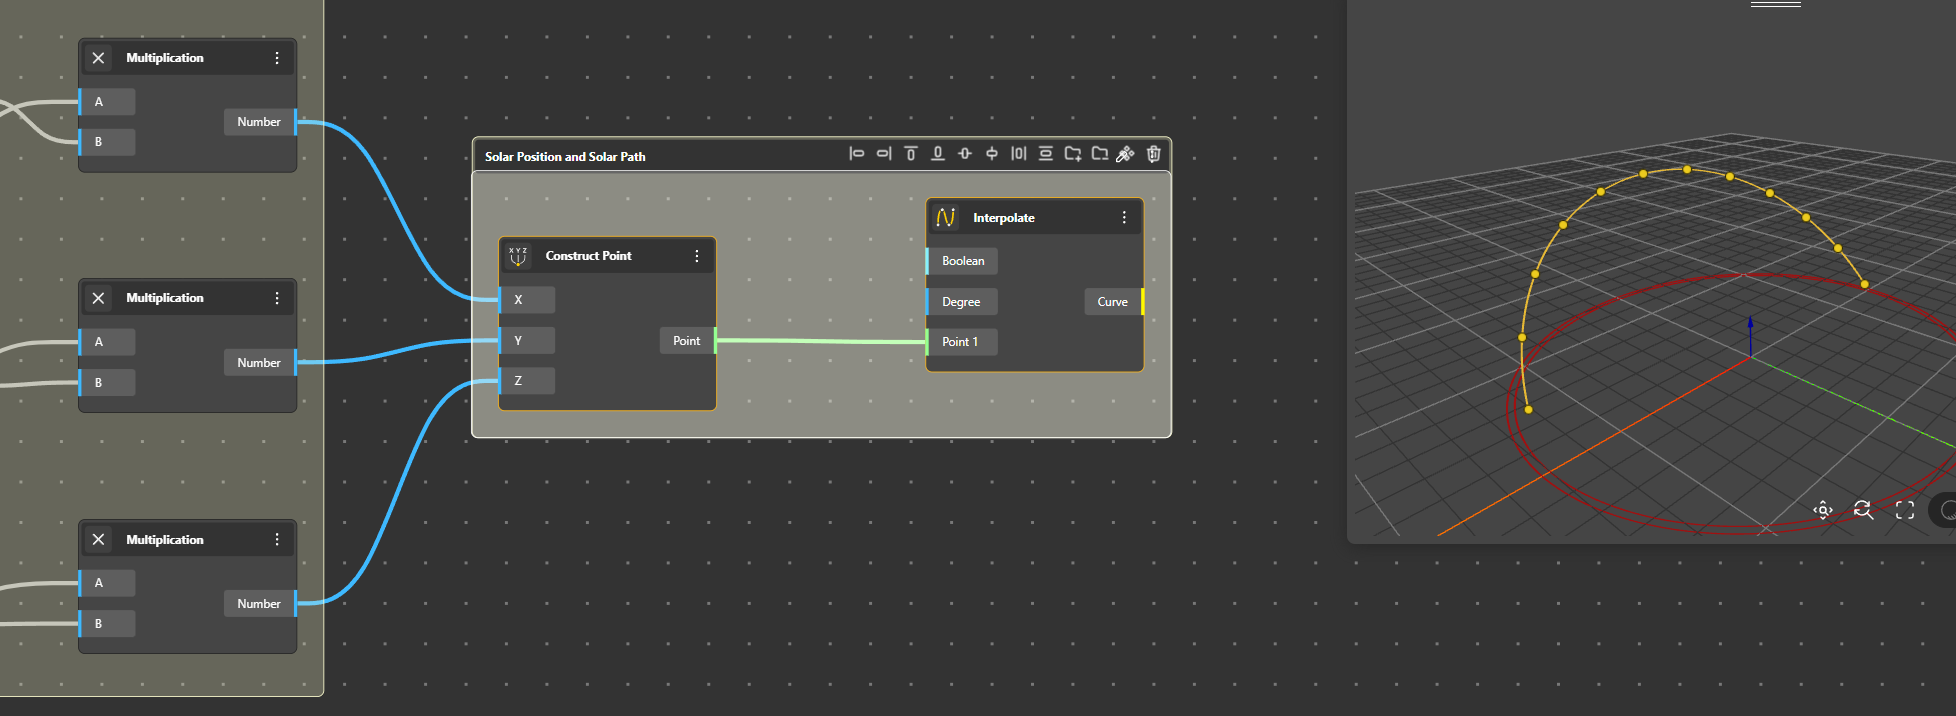
Mission accomplished, from that we can trace a line to visualise and use the solar ray whenever we want to.
Adding texts.
Adding a text in Beegraphy is easy and not easy.
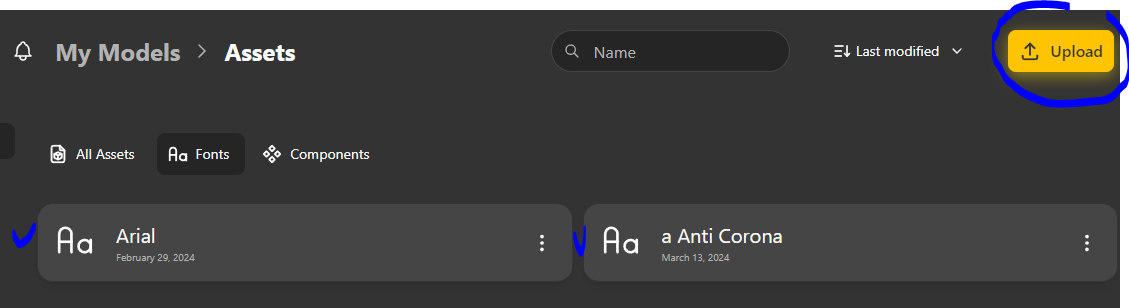
First we have to upload a Font
Back in the home space, we must identify the assets

In assets we can upload our fonts
Then we can go back to our model space. Select the Font Component and choose the Font that will be used:
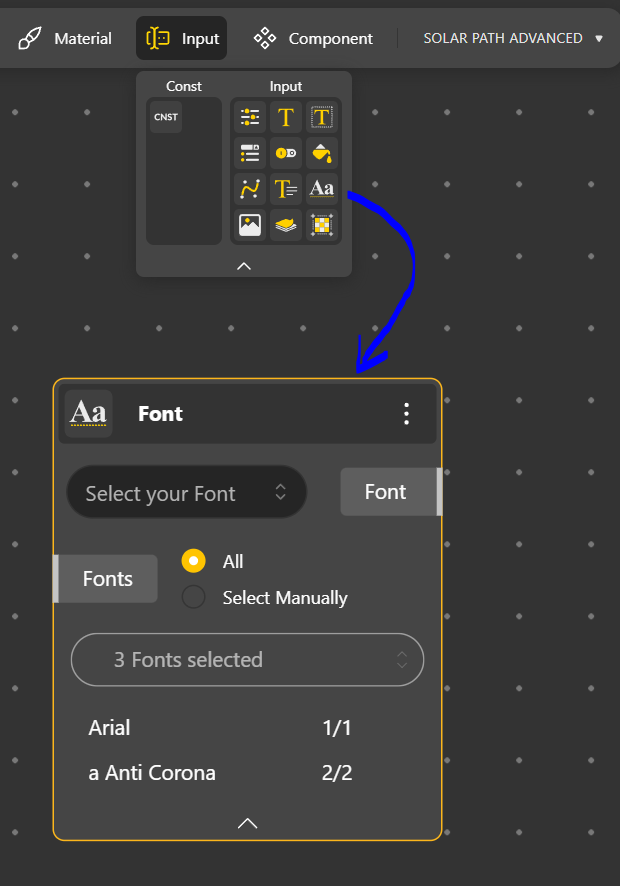
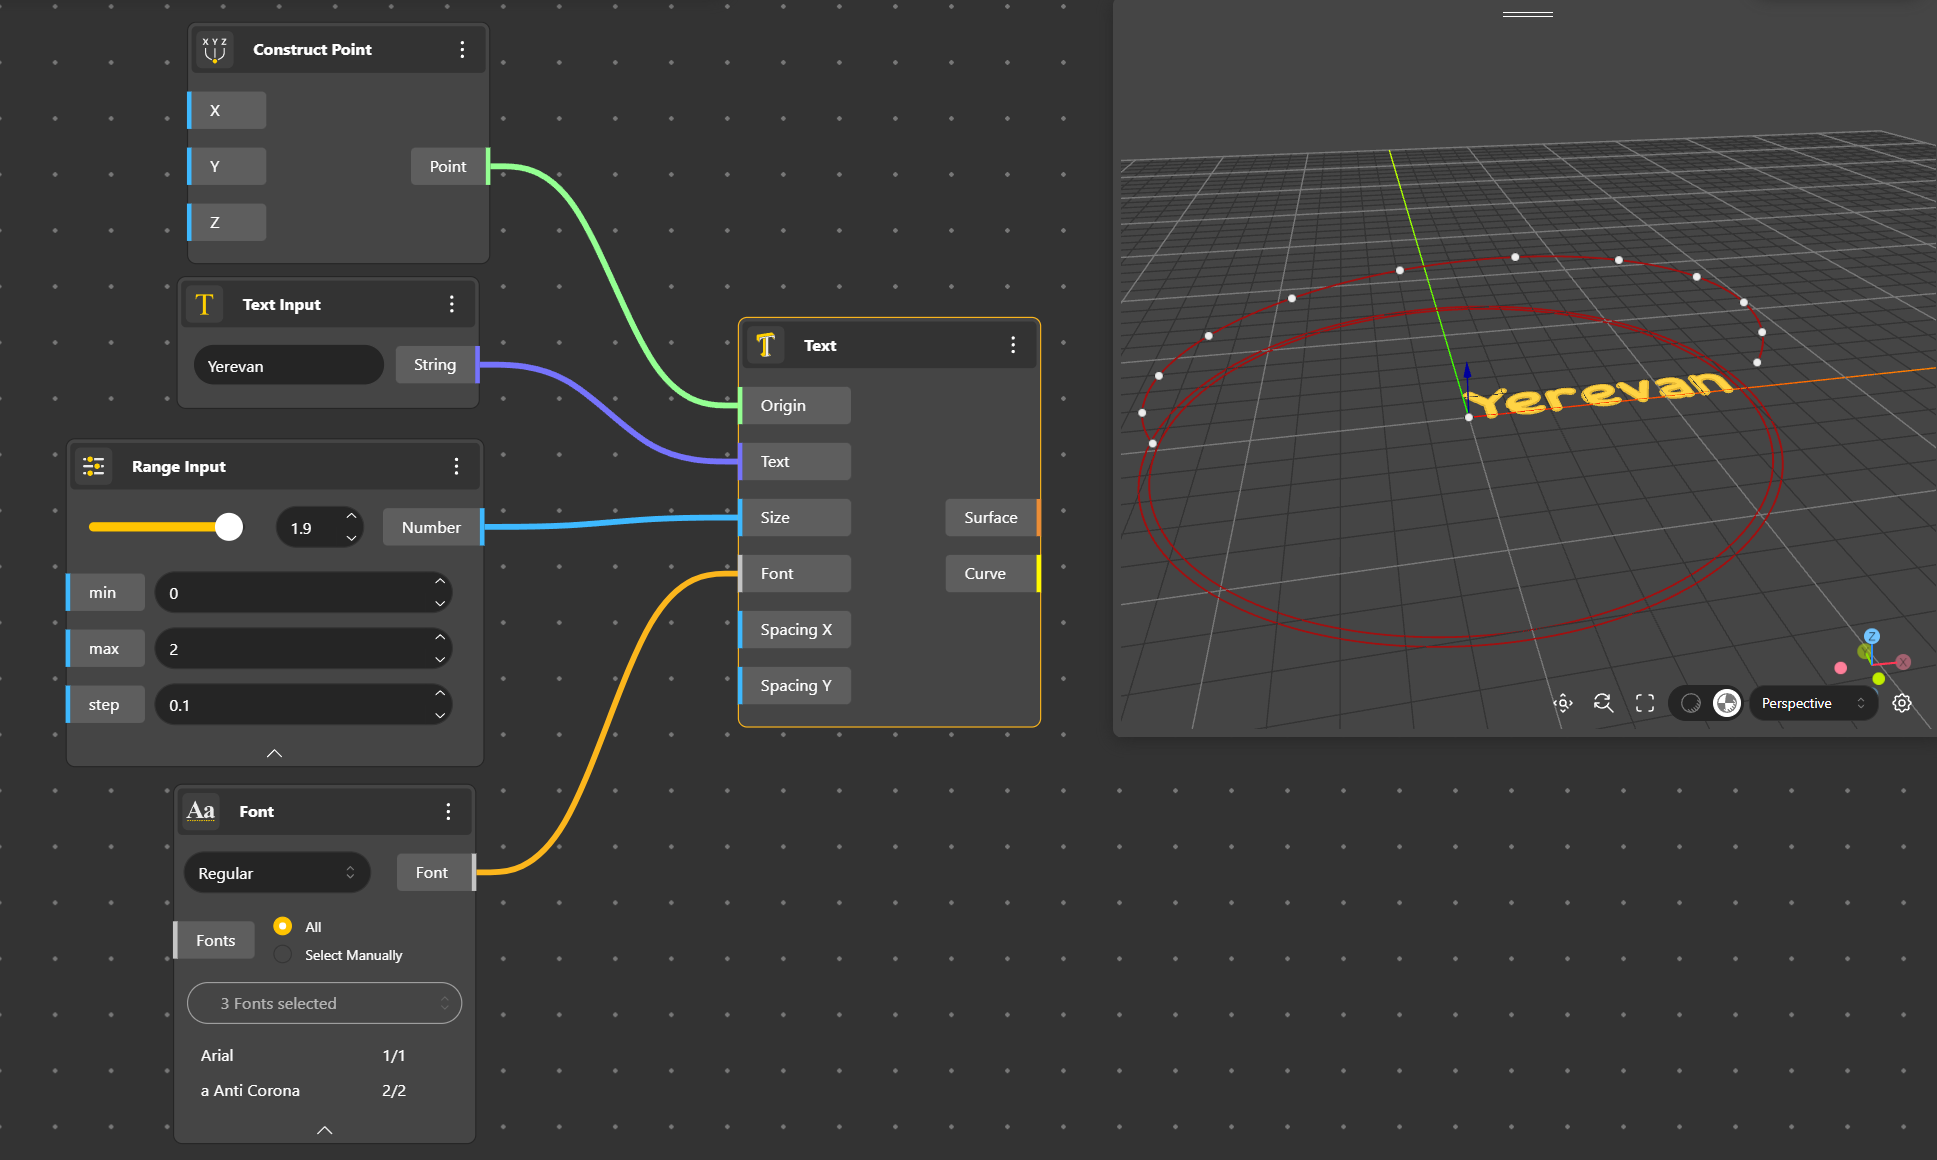
We take the Text component
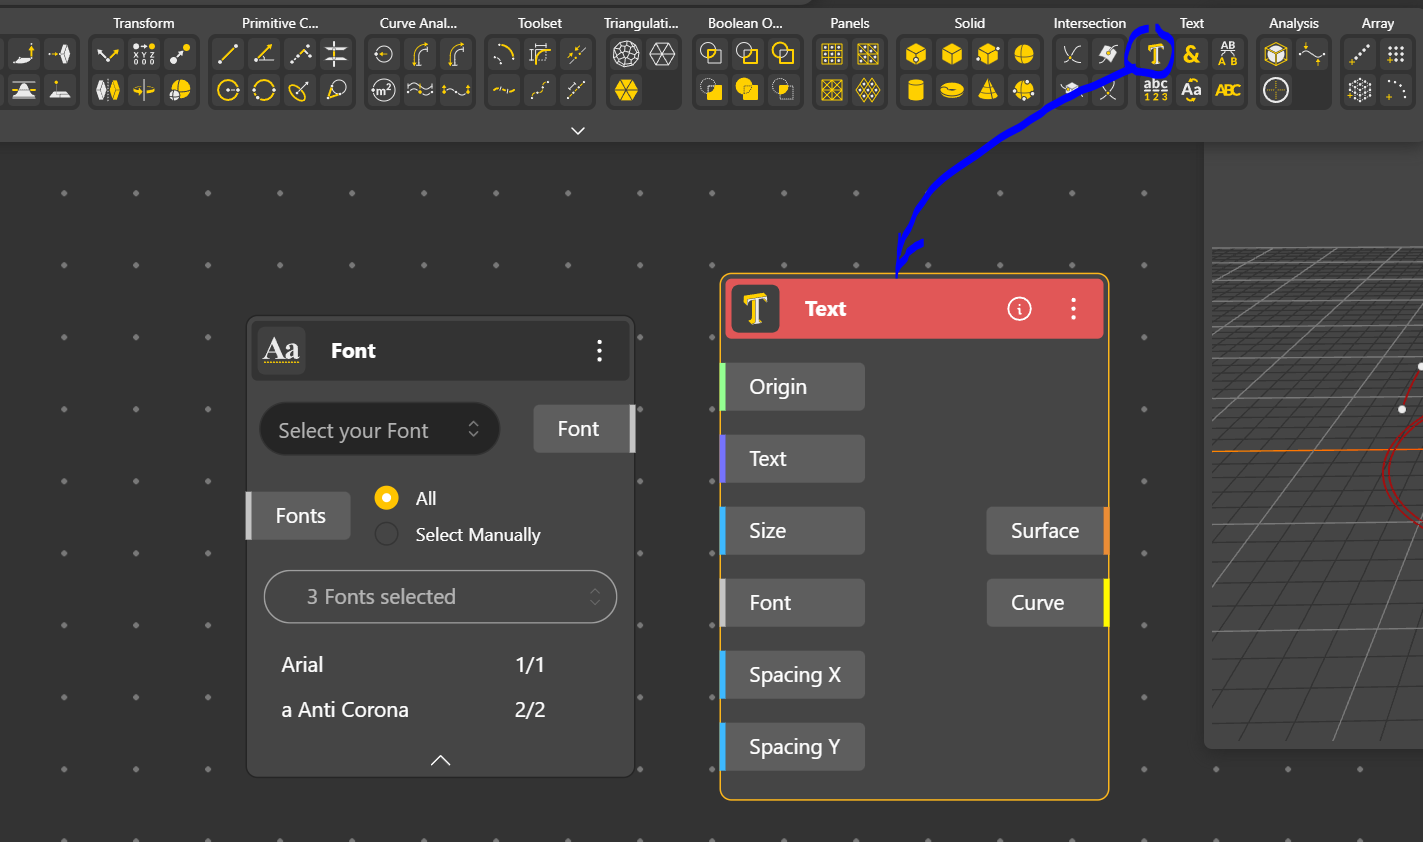
This is the final setup
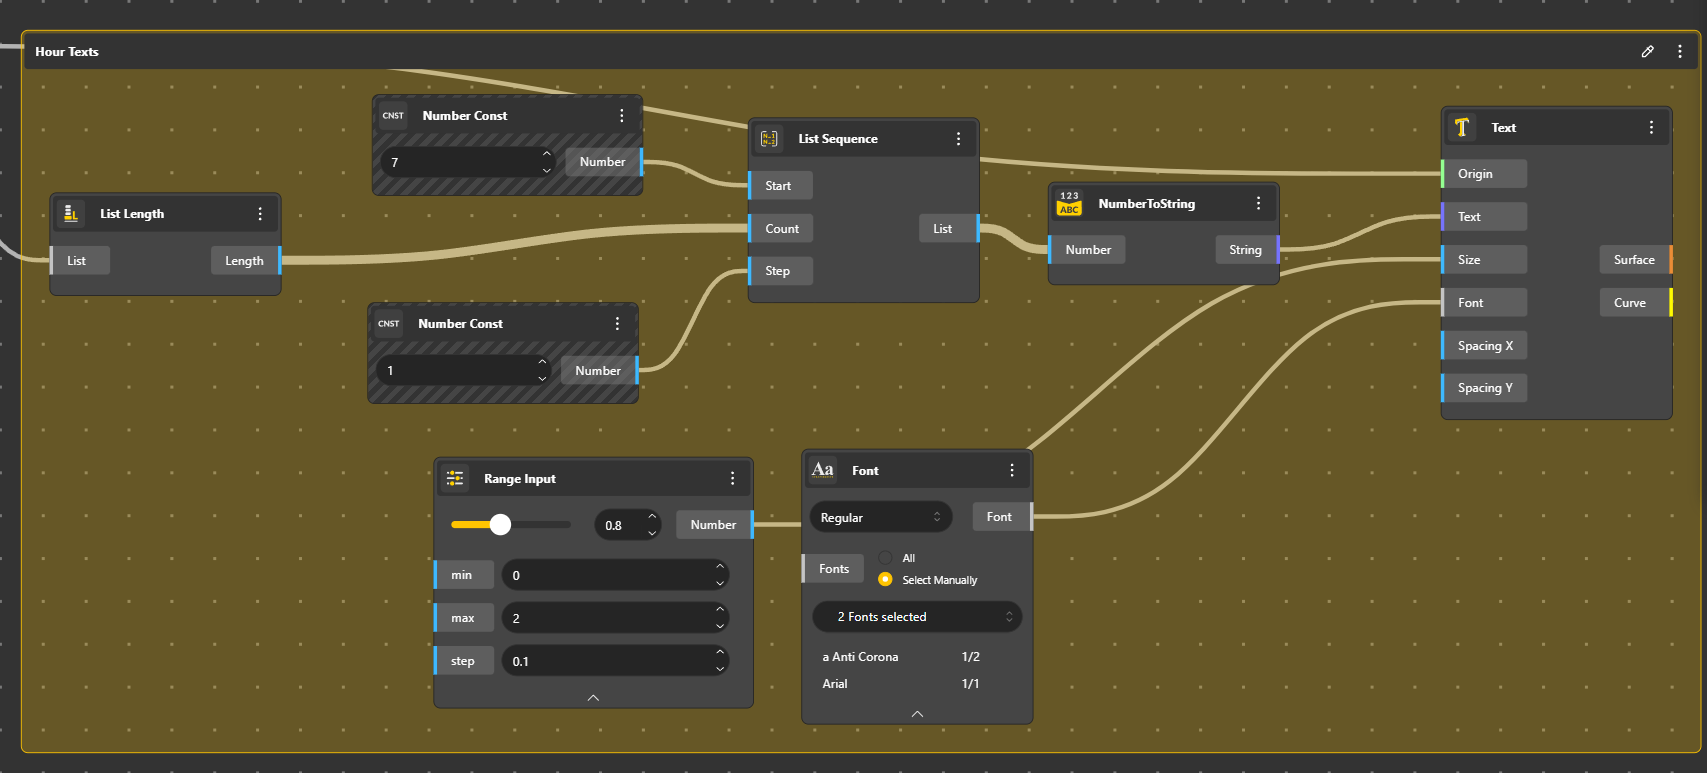
Adding hours at every solar position
We want to automatically number the hours. For that we will use a List Sequence Component
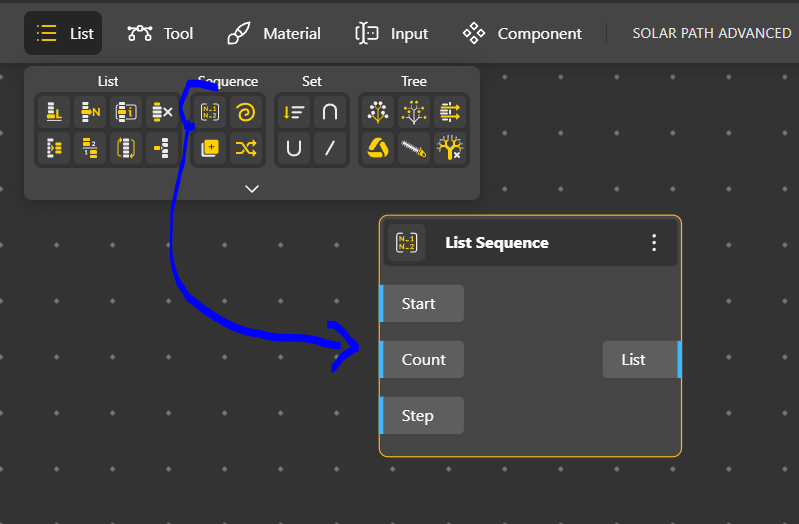
The Start value corresponds to the first hour, in our case 7:00 am
Count is the number of values, we can have it from the number of points using the List Length.
Step, is how we go from one value to the next. As it is every hour, it will be 1.
This is the final setup
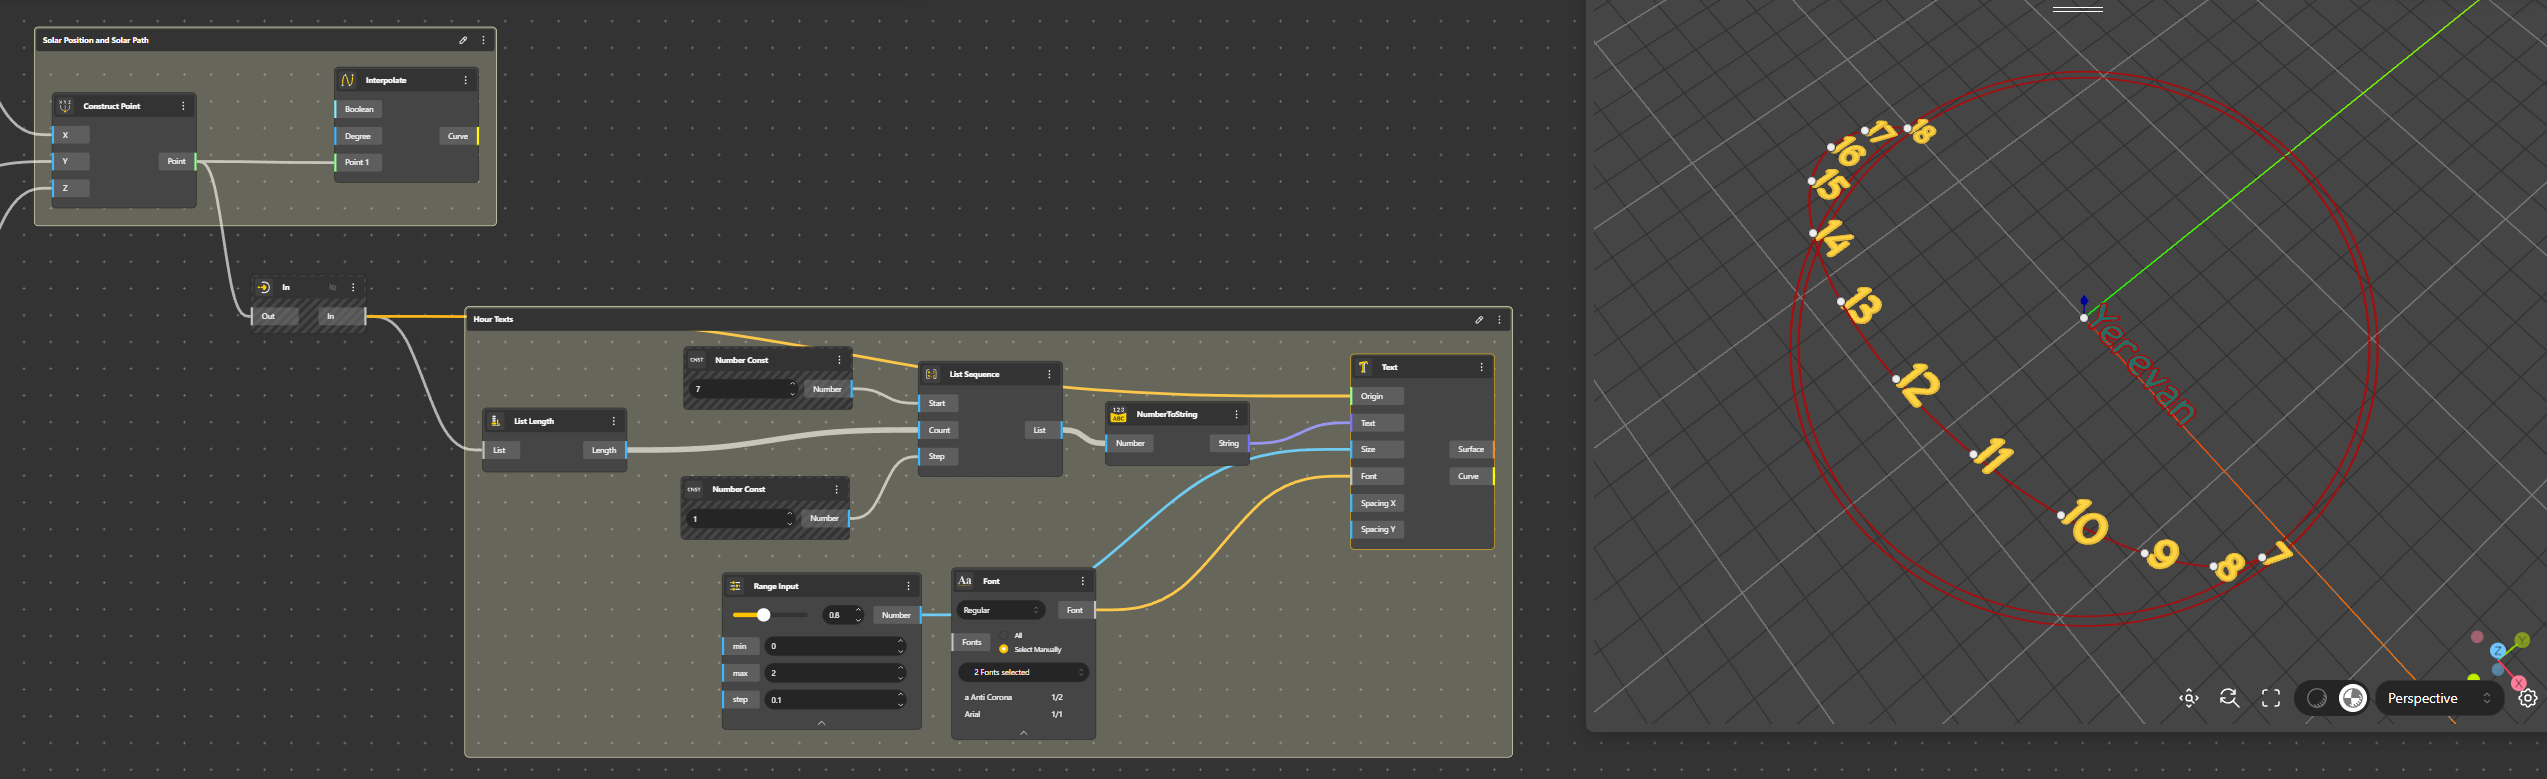
We used a In Connector as a relay to connect the List Length. The connector is just the way to organise our working space.
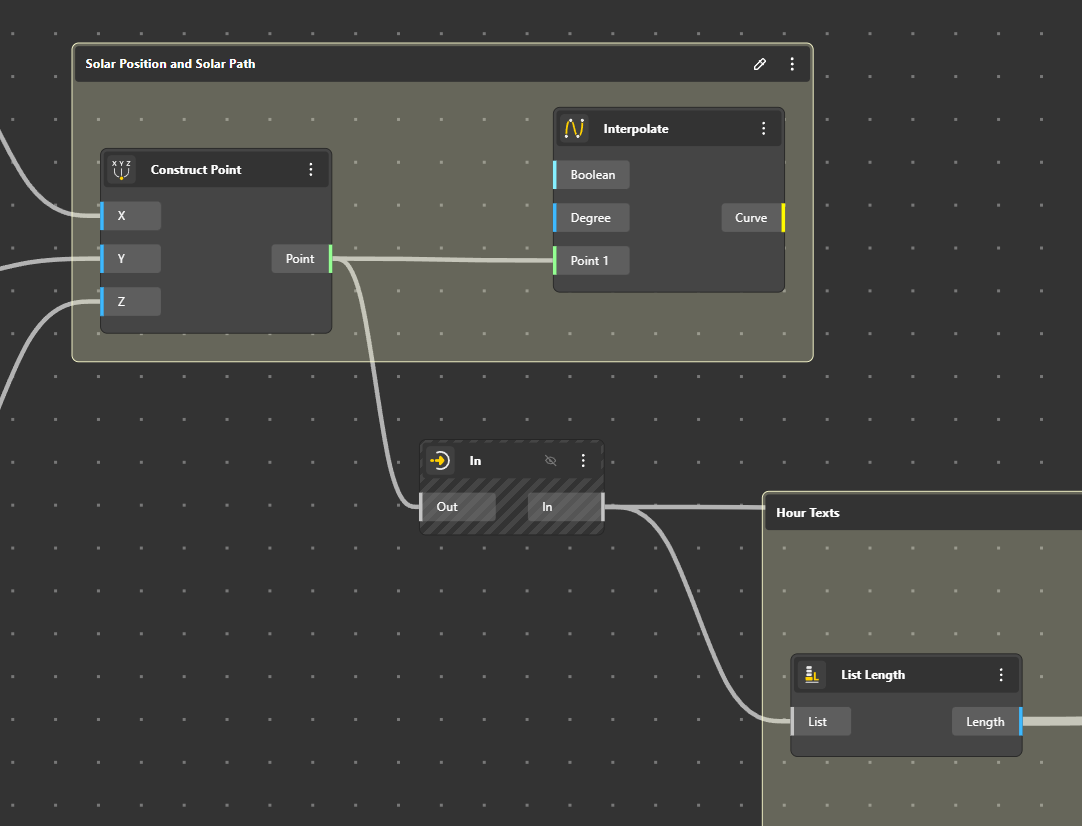
The detail of the setup for the text.
Solar Beam
Ok, now we want to visualise the solar Beam. It’s easy.
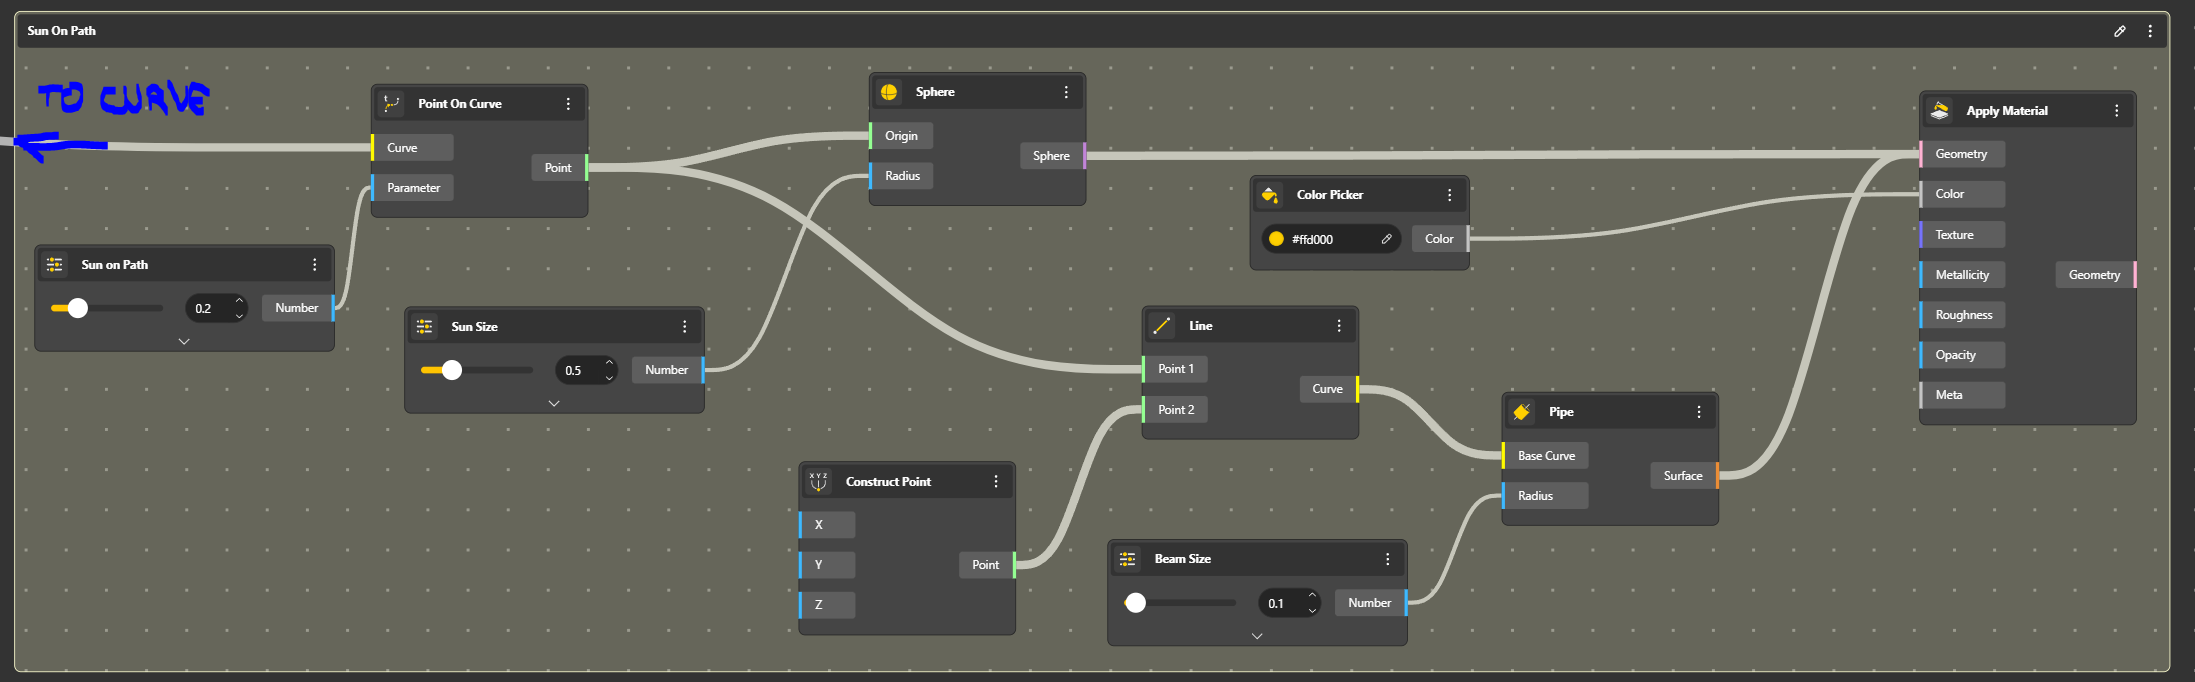
We just have to define a Point on Curve
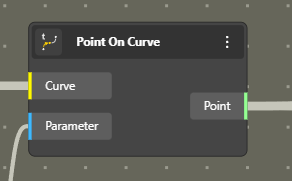
The Parameter describes a value ranged between 0 to 1.
Note : It is possible to edit components description. Very useful, we will see why afterwards.
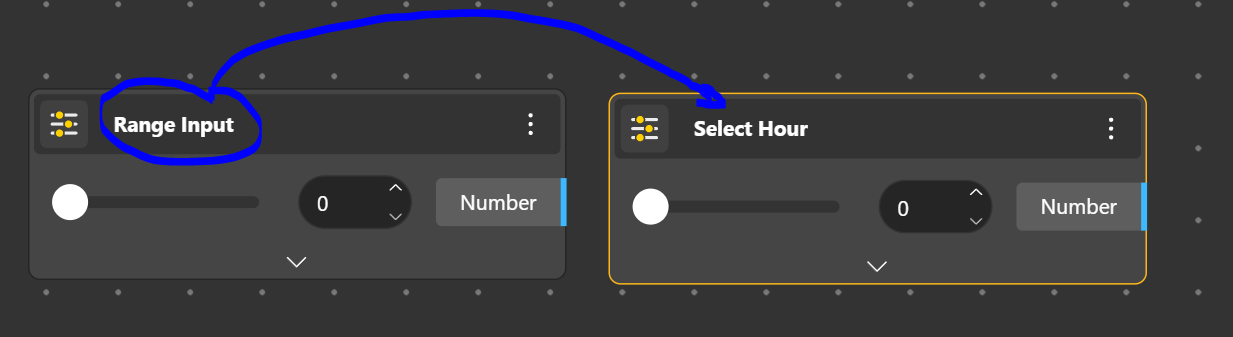
Just double click on the text and edit it.
The final setup will look like that
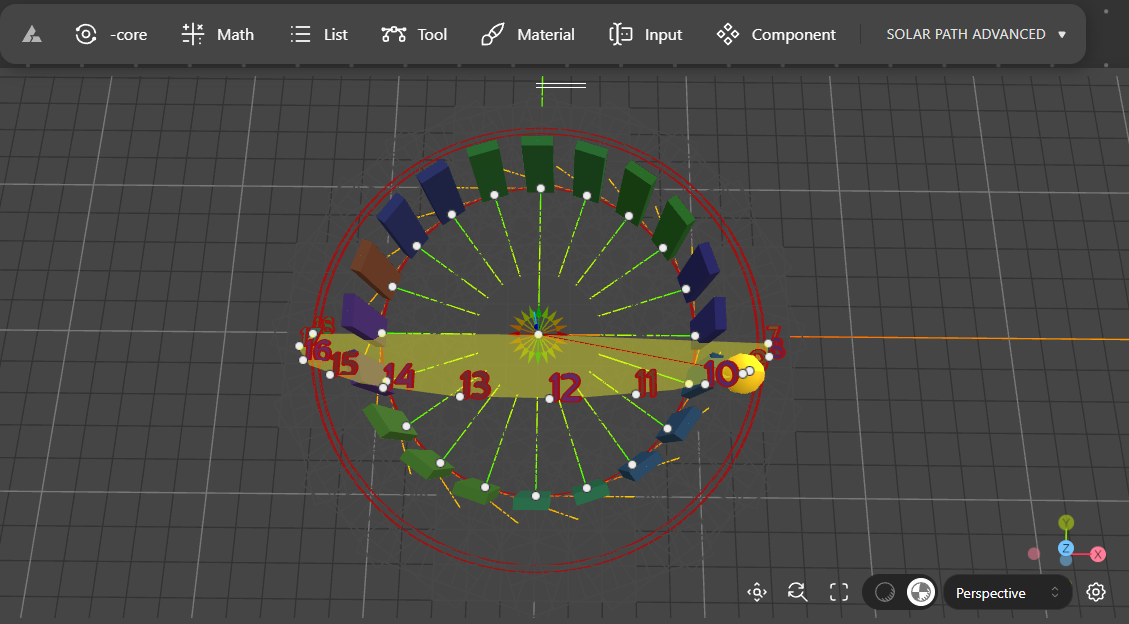
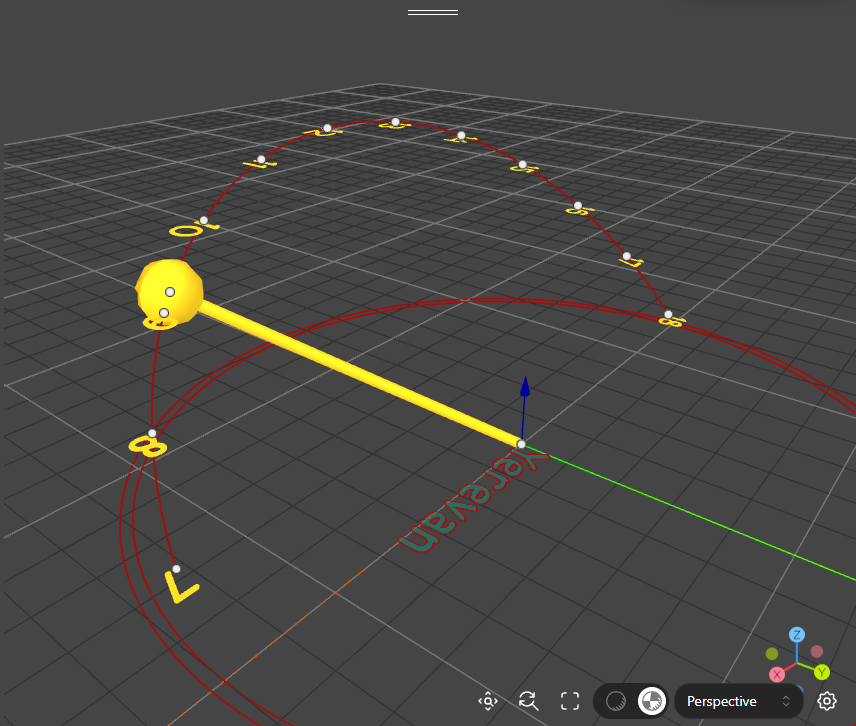
To better view the sun path, we can create a fan that represents all positions and vectors.
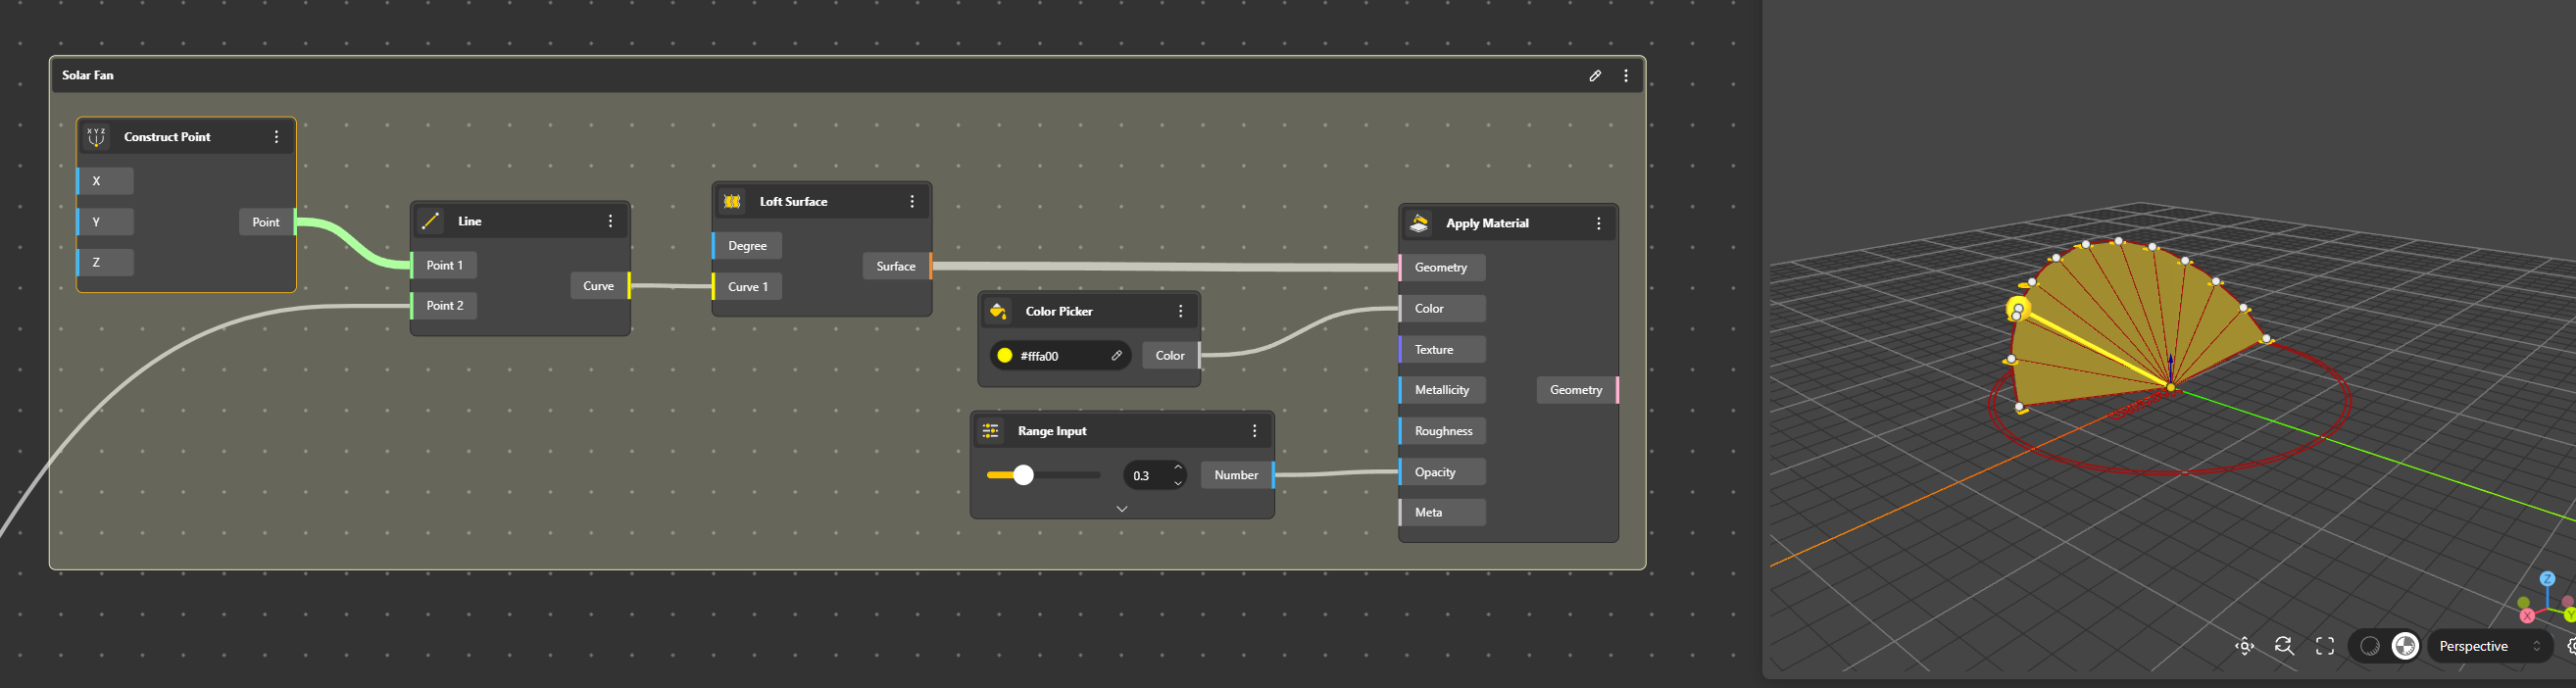
Ok, our sun path system is set, this is how it looks
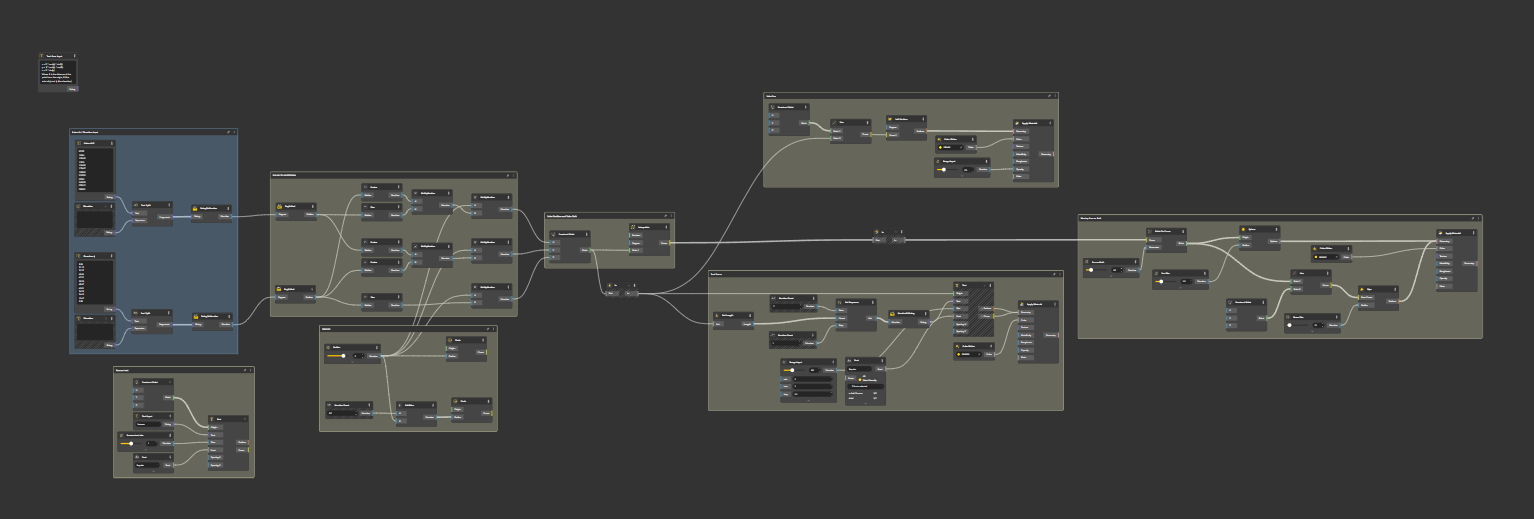
Doing groups allows to know precisely what is doing what. We will see why now.
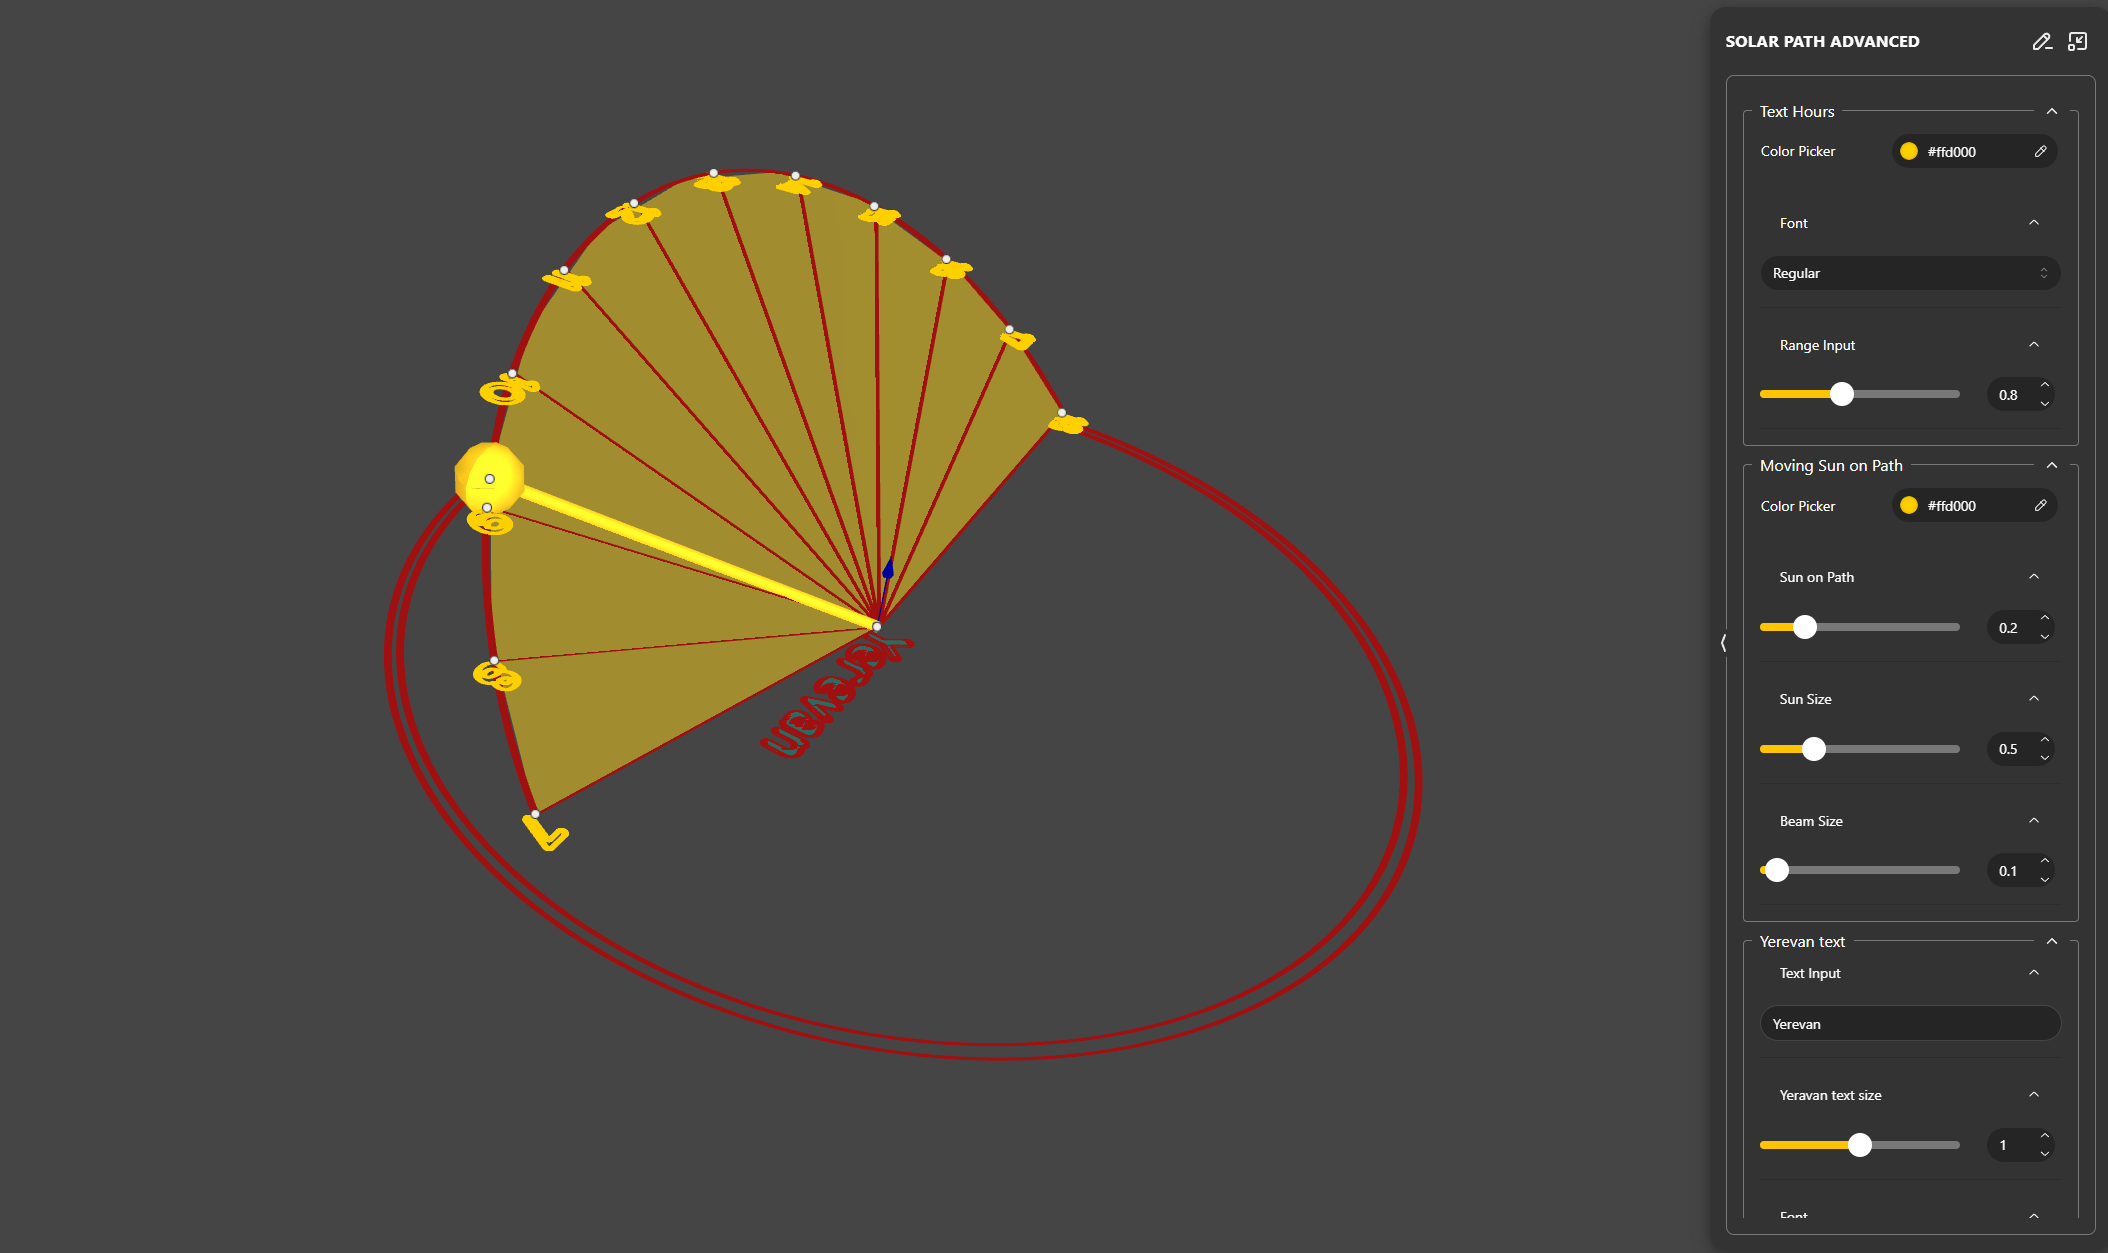
Sharing, playing with
By clicking on the diamond, we have access to an open access interface to play with the components

We find all our components and variables to play with