Originaly published as Gavrinis, The raising of digital stones : http://www.researchgate.net/publication/258641886_Gavrinis_The_raising_of_digital_stones
DOI:10.1109/DigitalHeritage.2013.6744825 Conference: Digital Heritage 2013, At Marseille - France, Vol: 2
Abstract — The Tumulus of Gavrinis, which is located in Brittany, is one of the best known monuments of Neolithic art because of its extraordinary engravings. A joint team of archaeologists and architects began recording the monument using digital multiscalar technology in 2011. The scanning was complicated by the narrowness of the inner spaces, uncomfortable conditions, granulometry of the stone, and extensive vegetation coverage.
A huge database was created by using a combination of photogrammetric technology and low-tech scanning methods. A lot of post-production work was needed to turn the cloud of data into a clean 3D model, since the original tumulus is irregular and lacks any repetitive patterns or predictive geometry. The goal was to obtain a detailed geometric analysis of the tumulus in order to develop a better understanding of its architecture and engravings, which are sometimes less than a millimeter deep.
This article covers the technological solutions that we applied while confronting situations ranging from the need to enhance a carved figure to our effort to reconstruct the entire monument by collating the results of several different recording techniques.
Keywords—Gavrinis; Neolithic; cairn; passage grave; archeology; lasergrammetry; photogrammetry, low-tech techniques; reconstruction; public presentation; real time visits
Laurent Lescop
Laboratoire CRENAU-Nantes
Ecole nationale supérieure d’architecture de Nantes
Nantes, France
Serge Cassen
CNRS, Laboratoire de recherches archéologiques
Université de Nantes
Nantes, France
Valentin Grimaud
Université de Nantes
Nantes, France
I. Introduction
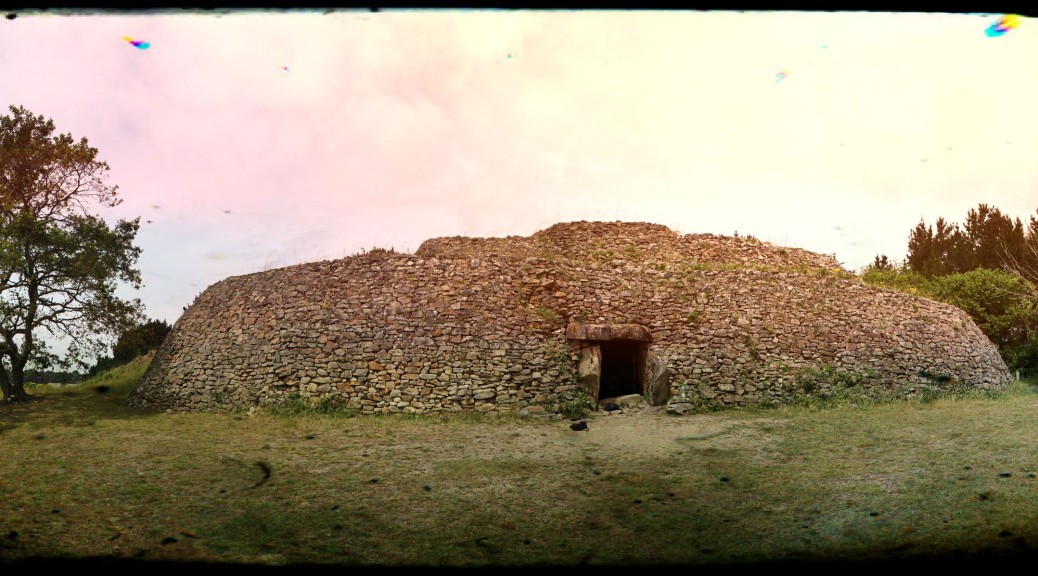
The Tumulus of Gavrinis, on the estuary of the Vannes River in Brittany (Morbihan, France), is known for the extraordinary abundance of engravings on the monolithic pillars that form its walls. The monument has always been a landmark from its erection in the early fourth millennium BC until now. Scientific efforts to describe the engravings have been made ever since the first descriptions in the 19th century, bringing the site wide scientific and popular renown (Mérimée 1835; Le Roux 1998).

Fig. 1. Gavrinis, outside view of the cairn.
Excavations in the seventies and E. Shee-Twohig’s precise description of the engravings in 1981 provided researchers with a corpus on which scientific work could be done. The invention of lasergrammetry with millimetric precision made it necessary re-survey the site, since the technology has reached the point where it opens the door to new discoveries.
If the scientific need for a new survey is obvious, the recording must also serve the requirements of specialists in preservation and communication. Gavrinis is highly vulnerable, because of its being one the most famous places in Brittany. The present flow of 30,000 curious and passionate visitors is certainly more than the 16-meter-long by one-meter-wide monument can bear, because of the fragility of its engravings, so better protection must be considered.
There is also a need to celebrate the beauty of Gavrinis’ engravings at other sites, in part because a greater appreciation of Neolithic accomplishments can increase the willingness of both the public and decision-makers to protect less famous cairns and standing stones.
Another reason that knowledge of Gavrinis’ engravings should be shared with visitors at other contemporaneous sites in the region is that they were originally part of a complex network that has been hidden by rising sea levels, modern construction, and increased vegetation. The landscape that we experience today isolates each Neolithic site as a single entity, but that wasn’t the case when they were built.
These communication requirements mean that the new digitized corpus must be suitable for scientific work, use as a training tool for guides, and popularization, both in online applications and in media presentations at a variety of sites. All those different objectives had to be kept in mind during the post-production treatment of the point cloud.
II. Overall scanning process
A. Collecting the initial data
The overall process started with a raw Sketchup model based on C.-T. le Roux’s and E. Shee-Twohig’s renderings. As Gavrinis is situated on an island, which is only accessible by boat, and has a poor electricity supply, everything had to be carefully prepared. The main problem that emerged was the narrowness of the interior spaces. It forced us to imagine the scanning process as a progression from outside to inside, with a large overlap.
The survey involved recording geolocational data with different scales of acquisition. Thus the whole cairn and surrounding ground were scanned using a Leica Geosystems C10 which is a time-of-flight system. Then, the walls of the tomb and the upper face of the cover slab were recorded with a Nikon Krypton K610 scanner with infra-millimetric resolution associated with Kube software.
For the Leica recording, six stations were set around the cairn, white spheres were used as targets to help the merging process. Eight more stations turned out to be necessary inside the corridor to link the inside to the outside.
This system was selected for its polyvalence, allowing a single campaign to record both the architecture and slabs. The Leica system has a range of 300 m (albedo 0.9), 134 m (albedo 0.18) and a minimum range of 0.1 m. The resolution depends to the laser beam which, in this case, was between 0 to 50 m: 4.5 mm (based on FWHH), 7 mm (based on Gauss).
The orthostats in the passage are registered with a letter L for left and R for right and a letter based on Shee-Twohig’s nomenclature. They were recorded with a Krypton K610 from Nikon Metrology at an infra millimetric scale.

Fig. 2. Krypton K610 from Nikon Metrology associated with Kube software.
This scanner works with a 200-mm-wide laser beam. Its potential precision is 37 µm but a precision level of 0.5 mm was considered sufficient, for the moment. It turned out that this level wasn’t precise enough for further analysis, but the gap was filled by using by an analogic oblique lighting method (Cassen et al. 2012 and forthcoming).
Each engraved pillar holds three to five million points. Focusing software was used to clean up the data and transcribe it into both XYZ and STL formats. The recording of the pillars represents 72,399,271 points. The recording of the cairn and its surroundings required 3,937,900 points. After eliminating redundant information and extraneous features such as plants and trees, we got a total of 93,564,668 points geo-recorded in the Lambert II and IGN 69 coordinate systems. The merging of all the point clouds was done in Leica Cyclone. The IMP files were then exported in XYZ, PTS, and TXT. A first raw meshing was exported in STL and OBJ.
B. First results
The first result provided a precise cross-section of the cairn, positioning the corridor very precisely in the mass of the monument. From the point cloud, it was quick and easy to draw a ground plan and elevations as well as horizontal and vertical sections.

Fig. 3. The position of the corridor in relation to the mass of the cairn.

Fig. 4. The assembled point cloud of Gavrinis.
Unlike many other passage graves (Mané Lud, Mané Rutual, Petit Mont, Table des Marchands), no precise blueprints existed for Gavrinis. An angular deviance of 25 cm exists between the last rendering (Le Roux 1985) and the one we have now in the path from the the entrance to the back of the chamber.
The cross-section of the passage confirmed the presence of a previous mound underneath the one we know (Closmadeuc 1864; Cassen, Boujot 2000). The angle of the slope, can be measured (2°) even if we know the ground has been excavated and may be a bit different.

Fig. 5. Groundplan of Gavrinis’ corridor

Fig. 6. Section of Gavrinis’ corridor
Focusing on the orthostats, it is now possible to superimpose the lines of the engravings on the shapes of the stones. Knowing the morphology of the surface helps enormously in interpreting and establishing a chronology of the drawings (Cassen 2012).


Fig. 7. Exemples of orthostats : L7 and L5
The laser recordings also made it possible to measure and compare the depths of the engravings. Some seemed to be more altered in a certain direction, confirming the hypothesis of former use before the engraved blocks were in the cairn (Le Roux 1984). The erosion, visible with a simple flashlight, cannot have happened inside the enclosed space; the stones must have been standing outside before being embedded in the cairn. The atmospheric effects, meteorisation, are now highly visible and can be shown in sectional views.
III. enhancing the engravings
Twenty-three out of the 26 pillars are engraved with a complex network of lines, figurative objects and dense patterns. Motifs cover the entire surface of pillars, often slipping around the sides. The details show the astonishing richness of the composition, which plays with the initial shape of the stone.
A. The L6 case
We will use Pillar n°L6 (Meaning the one in the sixth position from the entrance on the left) as our first example because of its iconographic and recording challenges and enormous potential. The purpose here is not to describe the precise significance of signs and patterns; but to depict the means that led to better analyses.
The first idea was to mimic an analogical process with software. Using oblique lighting is highly efficient in revealing details, but it takes time, requires being on location and is sometimes uncomfortable, because of the size and shape of the the spaces being recorded. A CG process on a dense geometry would give the same results.
The first tests were made with Meshlab, but despite of the free software’s benefits, the processing took too long: every step took dozens of minutes to complete. VrMesh was also tested, but the processing was still long. This software now specializes in Lidar data recognition. In the end, Geomagic was chosen after several tests, both because it finished its calculations faster than the competing programs and because it offered a lot of tools for building perfect geometries, which was our goal for further real-time use.
A mesh of 2,501,332 triangles was formed out of the point cloud and virtual lighting was used to simulate oblique lighting. The flexibility offered by this approach proved to have added value over the analogous method.


Fig. 8. L6, digital oblique lighting tests.
A further refinement was added to complement these results. The geometry was copied and then smoothed to a high degree. This new geometry is intercalated with the original one, in a new color, filling in the lowest parts of the engravings and giving the whole a flatter look, which allows the engravings to be more easily read in relationship with each other.

Fig. 9. L6, ungravings revealed by a smooth intercalated geometry.
The idea of having an intersection layer was presented by J.A. Sanz (Sanz and al. 2010), who demonstrated its utility with a single sample, whose surface was flatter than ours. A relatively flat shape was placed virtually halfway down the engravings, isolating their upper parts. Our technique is very similar, but has to work with more complex 3D surfaces. It requires step by step adjustments and a lot of fine tuning, depending to the depths of the engravings, granulometry of the stone, and overall shape of the orthostats. Many tests were necessary to find the optimal smoothness for achieving the greatest clarity. Both the original and smoothed geometries are shown in our results.
The deviation between the smoothed and original surfaces also produced good results, which allowed us to extract further information and provide a better synoptic view of the engravings. For example, it was possible to use the color spectrum to make the depth and width of all the lines within a 6 mm range clearer than they were in the original renderings. This work was done in Geomagic.

Fig. 10. L6, deviance analysis from the original mesh and a smoothed one.
Interesting details then emerged in this deviance analysis. Some figures became more recognizable and could be found carved on several standing stones. One of them, with a triangular shape, is an axe, replicating the exact form of a polished axe. The turning light technique (which consists of taking a large series of photos with oblique light oriented at a different angle for each view), detected a very interesting detail that could be isolated and measured. A tiny hole in the figure of an axe, previously barely visible, looked, in size and shape, to be very similar to those observable on real axes (Pétrequin et al., 2012)

Fig. 11. L6, deviance showing hole details in the figure of an axe. A third hole can be seen.
When the zone with the triangular shapes was mapped topographically, the curves formed by the contour lines revealed the holes. This procedure provided a further way of detecting and measuring an interesting element. Further analyses of these details are the domain of specialists, among them, traceologists.

Fig. 12. L6, hole corresponding to real objects.
The first step in interpreting the engravings is establishing their chronology. Knowing their temporal sequence provides clues for understanding what we will provisionally call their “nonfigurative signs”. Making chronological assessments requires the use of both real oblique lighting and the digital techniques described above. The overall process can be summarized in the following drawing: And it has to be done for each pillar.

Fig. 13. L6, analysis process for one stone.
B. The covering slab
The slab that covers the chamber is well known for being part of a gigantic stone broken into 3 main pieces, which were reused in two major monuments.

Fig. 14. The connection of slabs as a single piece (Cassen).
The figurative engravings on the upper side of the slab fit ones at La Table des Marchands. The theory that the slabs at the two sites were originally joined is confirmed by the fact that their broken edges match each other perfectly.
The covering slab is only visible in the chamber and from above, in a space that was made over the chamber in modern times for viewing the engravings. The laser scanning captured both the top and bottom sides, but, of course, the embedded parts were inaccessible to the scanner. The stone itself is therefore only visible in the resulting renderings only as a vacuum.

Fig. 15. The slab is revealed as a vacuum between two surfaces.
By isolating the two surfaces, it becomes possible to understand how the slab lies on the pillar. The thickness is also measurable.


Fig. 16. P10, the two surfaces and view from above.
The two sides were imported into Mudbox for overall reconstruction. Starting from a basic volume, the sides were applied like stencils, transferring all their tiny details to the new geometry. The invisible parts were then sculpted.

Fig. 17. P10, The yellow parts shows the theoretical reconstruction of inaccessible embedded portions of the slab.
The upper part of the covering slab is only visible from a room created during the monument’s restoration in the early seventies. The fact that the floor of this technical space is precisely the size of the engraved slab makes it impossible to put the laser scanner anywhere else than on the slab.
The narrowness of the chimney, which provides access to the space via a ladder, makes it impossible to use many scanning systems. It even made it difficult to get the scanner, cameras and other small devices into the space and impaired our ability to completely record the slab. As a consequence, large parts are absent from our laser scan. Hopefully, they are not among the most interesting areas.
We decided to use photomodelling to complete the model and add color information that didn’t exist in the point cloud. A Canon EOS 600D camera with a Canon EF-S 18-55mm f/3.5-5.6 IS II lens was used for this purpose. Two projectors with natural daylight colors were positioned to increase the light and distribute it in the most homogeneous way.
The main problem in such an enclosed and dark place is to avoid projecting one’s own shadow upon the subject of the photography, especially when it is on the floor. The overlapping of views also has to be anticipated. In this case, it was necessary for the photographer to revolve in place over a specific detail.
Photoscan was used. The model was completed using 500,000 vertices, which produced 250,194 polygons. The texture was calculated as an orthophoto which can be used as a texture. The laser model and orthophoto obtained by photomodeling were blended to fill in areas missed by the laser and provide texture.

Fig. 18. P10, orthophoto of the upper face.
A clean texture with proper UVW coordinates can be used for a real-time model on which it is possible to append graphic information to make it easier to interpret. This side of the slab is not open to visits by anybody except researchers. The only representations are drawings in books. Our results make it possible to examine the engravings on the upper side of the slab for the first time by visiting the space above them virtually.

Fig. 19. P10, CG model for real-time use with interpretation.
C. The threshold slab.
Another step in making an overall virtual model of Gavrinis was scanning parts of the tumulus, which are now held elsewhere, so they could be re-incorporated in the final digital model.
The threshold slab, which is registered as S12, is kept in a repository of the Regional Archaeological Service of Brittany in Vannes. Three recordings were carried out on this specific stone. The first used the turning light method, which emphasizes details; the second was a regular scanning process with the same device, the Krypton K610, used in the cairn; the third one was photomodeling.
The resolution chosen for the scanner was 0.5 mm. After the cleaning and meshing process, we got a total of 17,274,685 polygons. The deviance technique was used to enhance the details and better define the engravings.

Fig. 20. S12, Mesh model from K610 laser scanner .
The third recording for photomodeling involved photogrammetry. We used a Canon EOS 500D at 18 mm. The subject was exposed in an ideal diffuse light environment. 14 photos were taken for the top side and then 29, for the rest of it.

Fig. 21. S12, samples of photos used for photomodeling.
Visual SFM and 123Dcatch were then compared for the reconstruction and both of the results to the laser recording. 123D Catch is a free online application offered by Autodesk. It is a “black box”, meaning that it only has a few tweaking solutions, but the reconstruction is usually good. In this case, the deviation of 123DCatch was only 1.78mm.
Visual SFM is software that aggregates the photo-matching process, point cloud generation, and meshing. A lot of fine-tuning possibilities make it possible to produce a good survey. VSfm only deviated in this case by 0.98mm.

Fig. 22. Deviation between laser and 123Dcatch .
TABLE I. lasergrammetry and photomodeling comparaison
| Technique | Lengthmm | Widthmm | Thicknessmm | Volumem3 | Deviancemm |
| Lasergrammetry | 1274 | 794 | 296 | 0.218 | – |
| 123DCatch | 1272 | 797 | 298 | 0.225 | 1.78 |
| VSFM | 1279 | 814 | 296 | – | 0.98 |

Fig. 23. Deviation between laser and VSFM.
The deviance between the laser scan and photomodeling was not uniform. Depending to the light and number of photos used, the differences were between one and two centimeters, which provided satisfactory results for this kind of subject.
123Dcatch, which is free software, is advertised as offering real scale models. A short test showed that the results were close to the reliable ones provided by lasergrammetry.
TABLE II. lasergrammetry and photomodeling comparaison
| Technique | Lengthmm | Widthmm | Thicknessmm | Volumem3 | Masskg |
| Lasergrammetry | 1274 | 794 | 296 | 0.218 | 589 |
| 123DCatch | 1272 | 797 | 298 | 0.225 | 607 |
The problem remains that cameras are hardly able to reveal geometric details except if photos are taken at a very short distance for a limited surface or, if the light is oblique enough. Tests therefore should be made to measure the depth of hollows and their orientation.
D. P2 The hidden engraving.
Recording surfaces in tight spaces cannot be done without proper knowledge of the place. It requires an overall strategy, involving decisions as to where to put devices, what kind of moves to make, what parts need to be focused on, and what results one is aiming for.
We knew for sure that an important sign was carved in Gavrinis’s corridor. Due to close proximity between the motif and next slab, it was very difficult to record it, and we could not find a device that could slip into the gap. The widest part is only 14cm, and then it quickly shrinks to 1cm in a 40cm deep interstice.

Fig. 24. P2, position of the engraving
We finally used a Nikon D5000 at 18mm to get a collection of 32 photos (RAW format 4288×2848) and PhotoScan for the reconstruction. After cleaning, we had 72,471 polygones. It was possible to get a proper elevation and a front projection.

Fig. 25. P2, reconstruction with PhotoScan and front projection
IV. The cairn
The cairn is a dome, with a diameter of 25m and height of 8m. The main façade, which has been reconstructed, is a 30m long stone wall with grading. The rest of the monument is covered by vegetation, most of which is weeds. Before any reconstruction, the first task was to “mow” the tumulus by virtually eliminating all the plants and other unwanted natural information. Holes in the point cloud were filled.

Fig. 26. Cairn, huge mixture of vegetation and architecture
The stone facade offers lots of details of different size and automatic construction processes can be thwarted or generate highly degraded geometries showing spikes, tunnels, self-intersections, creased edges or small holes, even though the eye easily catches the overall shape and structure. The meshing was re-arranged and simplified (the goal with to stick between 50,000 to 300,000 polygones) to increase the regularity, aid volume calculations and make virtual visits in real time easier. This adjusted topographical model was in keeping with the details of a normal map and a depth map can easily be added.
Geomagic offers tools for reaching cleaner geometries, which are essential for any further post-production treatments. The retopology stage can be performed by many software programs, but it must often be carried out by hand and can be very time-consuming. The latest version of Mudbox provides another nice and easy tool for adjusting the topological parameters and the learning curve is acceptable. Using the model for real-time applications becomes easy.


Fig. 27. Cairn, before and after retopology, then textured for real time use.
V. Conclusion and discussion
Great monuments such as Gavrinis have been recorded for over 20 years. Other examples exist in England (Stonehenge), Ireland (Bru na Boinne), Scotland, Spain, and many other places in Europe (Cassen et al. 2013).
Gavrinis is a complex subject and more than one tool was needed to achieve our goals, which were to record, interpret, speculate and communicate. The overall digital reconstruction of Gavrinis is still in progress. Our work raised new problems, techniques and questions as it progressed. Neolithic funeral architecture is intractable: hidden parts often cannot be deduced from what can be seen, each part is slightly different from all the others, and yet the monuments are laid out precisely. Whether lasergammetry or photogrammetry is used, the recording process is usually constrained to confined spaces, obscurity and long distances from power resources.
That’s the reason why we added a variety of lighting and low-tech methods to our toolkit. Over our years of practice, which has teamed archeologists with architects, we have become deeply convinced of the importance of using several complementary devices and tools on the same subject. We are not just digging for information or trying to produce a better 3D computer model, but are trying to articulate scientific needs with the requirements of satisfying visitors’ curiosity.
Acknowledgment
The authors wish to thank the Ministère de la Culture et de la Communication, le CIRA (Commission interrégionale de la recherche archéologique) le CG56 (Conseil Général), le SDA (Sous-Direction de l’Archéologie). We are also very grateful to Y.Bellenfant, SAGEMOR (Société Anonyme de Gestion du Morbihan), the CNRS (Centre national de la recherche scientifique) and ENSANantes (Ecole Nationale Supérieure d’Architecture de Nantes). The authors also wish to warmly thank Duncan Caldwell for revising the text.
References
[1] Boujot C., Cassen S., 2000. La Constitution sédimentaire des tertres. In : Eléments d’architecture (Exploration d’un tertre funéraire à Lannec er Gadouer,Erdeven, Morbihan. Constructions et reconstructions dans le Néolithique morbihannais. Propositions pour une lecture symbolique). Chauvigny : Editions chauvinoises, Mémoire 19, p. 153-164.
[2] Cassen S., Lescop L., Grimaud V., Pour une critique de la représentation tridimentionalle des architectures mégalithiques en Europe occidentale, Méthodes et usages actuels, Annales de Bretagne et des Pays de l’Ouest, tome 120, n°1, 2013, p.7-31
[3] Cassen S., Lescop L., Grimaud V., Querré G., Suner B., 2012. Une approche multiscalaire du monument néolithique de Gavrinis (Larmor-Baden, Morbihan). Campagne d’acquisition 2011. In : Journée du « CReAAH » Archéologie, Archéosciences, Histoire. Rennes : Univ. Rennes 1, p. 13-14.
[4] Cassen S., Lescop L., Grimaud V., Querré G., Suner B., forthcoming. In search of a representation of the Gavrinis megalithic tomb (Morbihan, France), à paraître. In : 4th International Meeting on Graphic Archaeology and Informatics, Cultural Heritage and Innovation ARQUEOLÓGICA 2.0, 20th – 22th June 2012 Sevilla.
[5] Pétrequin P., Cassen S. et al. Typology, Chronology and distribution of large Alpine axeheads in western Europe, in Typology, chronology and distribution of large Alpine axeheads, Presses Universitaires de Franche-Comté n°1224, Collection Les cahiers de la MSHE Ledoux n°17, Série Dynamiques territoriales n°6, 2012, P. 574-727
[6] Sanz JO, de la Luz Gil Docampo M., Martínez Rodríguez S, Rego Sanmartín MT, Meijide Cameselle G, A simple methodology for recording petroglyphs using low-cost digital image correlation photogrammetry and consumer-grade digital cameras, Journal of Archaeological Science 37 (2010) p.3158-3169
[7] Closmadeuc G. (de), 1864. L’Île de Gavrinis et son monument. Vannes : Imp. Lamarzelle, 1864.
[8] Le Roux C.-T., 1984. À Propos des fouilles de Gavrinis (Morbihan). Nouvelles données sur l’art mégalithique Armoricain. Bulletin Société Préhistorique Française, 1, 8, p. 240-245.
[9] Le Roux C.-T., 1985. Gavrinis et les îles du Morbihan. Guides archéologiques de la France. Paris : Ministère de la Culture.
[10] Mérimée P., 1836. Notes d’un voyage dans l’Ouest de la France. Paris : Éd. Adam Biro, 1989.
[11] IEEE MultiMedia, Volume 7 Issue 2, April 2000
[12] Shee Twohig E., 1981. The Megalithic Art of western Europe. Oxford : Clarendon Press, 1981, 560 p.