Before exploring and analyzing the corpus chosen for the representation of atmospheres, a simple example will be observed to measure the difficulty of the game of the representation of atmospheres in the project. This example is that of the choice that a designer could have between the strip window and the vertical window of the Renaissance type. This example has already been mentioned in the previous chapter as representative of the gap that can occur between an architectural discourse, the realization and the perception of the users. It seemed interesting to us at the beginning of the discussion on figuration to show that representation is a complex act passing through words and drawing.
For the example of the ribon window, we have the opportunity to exploit a significant number of documents and studies containing drawings and the discourse that accompanies them. We have therefore naturally, in addition to the commentary on the texts and illustrations, named the type of discourse according to a common terminology used in literary analysis. We will then be able to note the coherence between what is shown and what is said. We could quite easily have organized the atmospheric illustrations according to the different types of discourse and drawn interesting conclusions about the relationships between words and images. We will leave that for an article.
According to Doyon and Hubrecht (injunctive speech)
In their book, Rural and Bourgeois Architecture in France , Doyon and Hubrecht [1]recount the transition from the horizontal window of the Middle Ages to the vertical window that characterizes the Renaissance period. For the authors, the possibility of building taller windows is the result of the evolution of masonry techniques.
« To properly light a room, it is especially important that the daylight falls from above, and windows that stop close to the ceilings achieve this result. There is also the question of ventilation. Too much rain prevents it from working properly, as can be seen from the production of smoke [2]. »
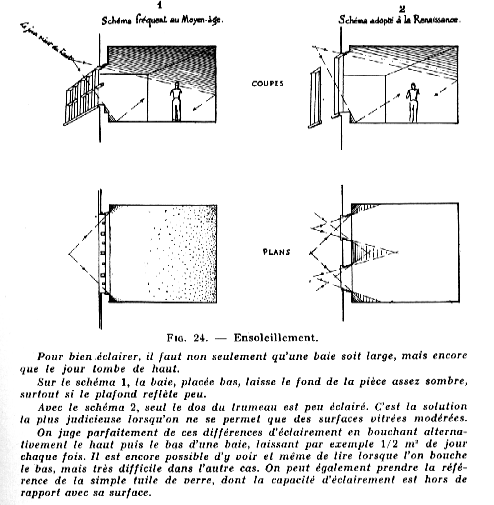 |
Doyon and Hubrecht illustrate their point with a diagram showing the distribution of light in both cases. This diagram describes the ambient sunlight/living room/occupant. For the strip window, the light is more homogeneous, but arrives very low. For the Renaissance window, the black areas are more pronounced, but the light arriving from higher up illuminates the room higher and deeper.
According to Le Corbusier (argumentative speech)
In these notebooks, Le Corbusier praises the ribon window, contrasting it with the tall Renaissance window. There are nuances between the medieval window and the window that symbolises the modern movement. However, it is interesting to examine the arguments put forward:
« I have stated that the ribon window (which precedes the pane of glass) illuminates better than the high windows. These are my observations on the spot. Yet I have vehement opponents. I have been told, for example: « a window is a standing man! » « So be it! If one likes « words. » However, I recently discovered, on a photographer’s table, these two explicit graphs; I am no longer swimming in the approximation of personal observations, I am in front of the sensitive photographic film which collects the light.
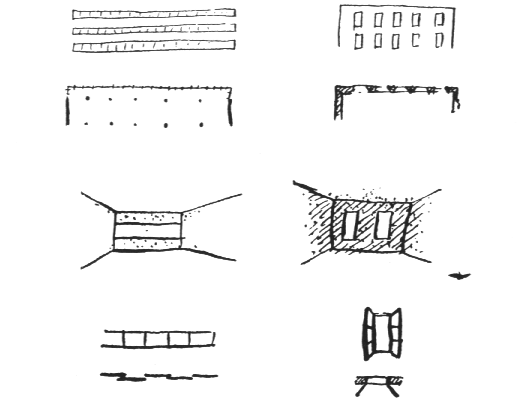
The table says this: with an equal glass surface, a room lit by a ribon window touching the two adjoining walls (it’s all there: refraction of light waves) has two lighting zones: a zone 1, very lit; a well-lit zone 2. On the other hand, a room lit by two vertical windows determining trumeaux, has four lighting zones: zone 1, very lit (two very small sectors), zone 2, well-lit (one small sector), zone 3, poorly lit (large sector), zone 4, dark (large sector). The table adds: « You will expose the photographic plate for four times less time in the first room . «
The sensitive film has spoken. Ergo![3]
Based on this « simulation » from a photograph, Le Corbusier made sketches showing the distribution of the zones
 |
The performance of the longitudinal window compared to the vertical window has been a source of questions for scientists. Le Corbusier’s deliberately provocative and polemical discourse invites critical listening and launches his detractors into work to verify these hypotheses. This was the case for the shadows of his « Radiant City. » The longitudinal window has been, and still is, widely used in the vocabulary of the architecture of large complexes, and more punctually in the private house. Since the sketch is necessarily partial, it is easy to imagine that only the physical approach will be able to give an exact account of the qualities of one or other of the openings.
According to the simulation (descriptive speech)
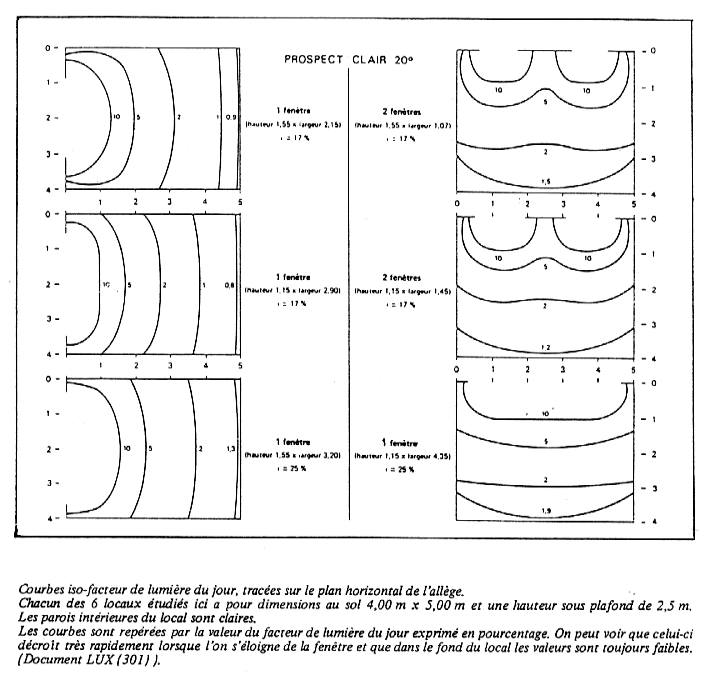
Thus, in 1983, the LUX magazine presented a comprehensive study [4]measuring light in six rooms measuring 4.00 meters x 5.00 meters with a 2.5 meter ceiling. For the record, the table below lists the physical quantities used to measure light.
| Sizes | Energy units | Light units |
| O flux (transported by a beam | watt (W) = J/s | lumen (lm) |
| Luminance L (in a radiation beam) = flux per unit of geometric extent | W /( m²-sr) | cd/m² (=nit) |
| Illumination E (of a receiving surface) = flux received per unit of surface | W/m² | lux=lm/m² |
| Exitance M (of an emitting surface) = flux emitted by a surface (= radiosity B ) | W/m² | lm/m² |
| Intensity I (of a source) = flux emitted by a unit of solid angle | W/sr | candela (cd) |
The results give the following graphs [5]:
 |
The results are expressed as a percentage of daylight factor according to the following table:
| Daylight factor on a horizontal plane | in % | under 1% | 1 ->2% | 2 ->4% | 4 ->7% | 7 ->12% | more than 12% | ||
|---|---|---|---|---|---|---|---|---|---|
| Very weak | Weak | moderate | AVERAGE | Pupil | Very high | ||||
| Interested area | In the area away from windows, distance about 3 to 4 times the height of the window | Near windows or under skylights | |||||||
| Impression of clarity | Dark and dimly lit | idem | dimly lit and bright | idem | clear to very clear | idem | |||
| Visual impression of the premises | This area | seems to be separated | of this area | ||||||
| Atmosphere | local seems to be separated from the outside (room, home) | Room opens to the outside (work room) | |||||||
If we find approximately the principles described by Le Corbusier, the difference (4 times!!) announced is certainly not in the same proportions. We can even see that the back of the room is better lit in the case of the vertical window.
The loss of opening surface deprives the room of significant natural light (200 lux compared to 80 lux according to the author [6]) and the distribution of the solar task is more homogeneous when there is only one opening.
 |
 |
 |
| Impact of the occultation of a part of the window in the length of the houses of the Modern Districts of Fruges . The first two thumbnails represent the light received, the last the difference between the two. The calculation is carried out using the Solène software developed at cerma . | ||
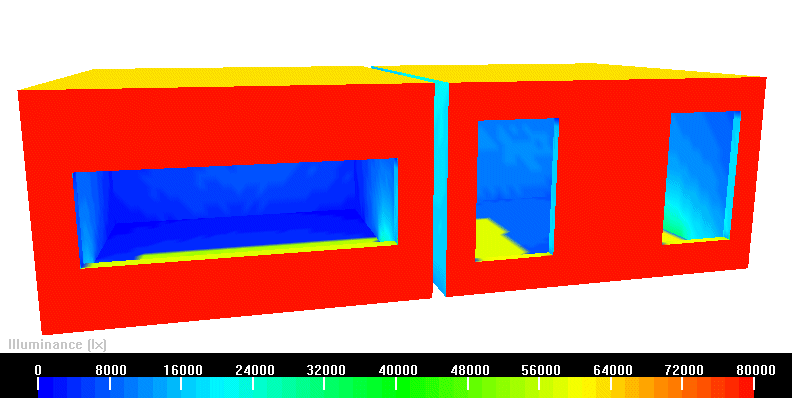
We used the principle of numerical simulation to observe the luminous behavior of a room when it is lit by a strip window in one case and a vertical one in the other, but this time by comparing with equal opening surfaces.
 |
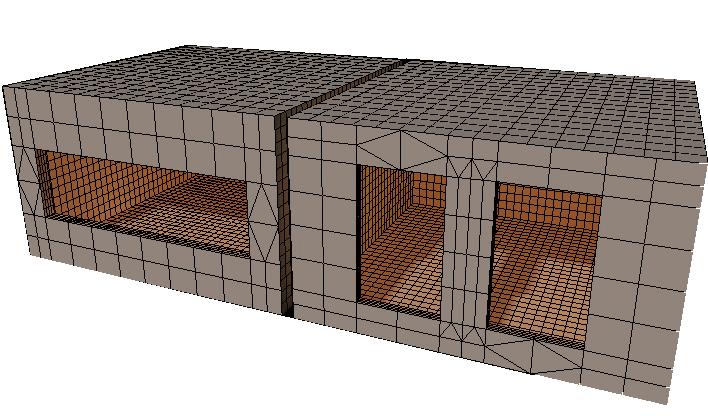 |
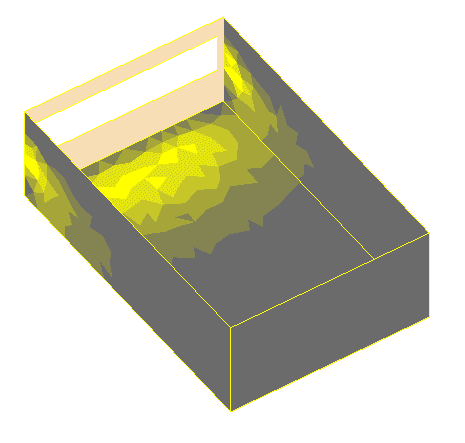
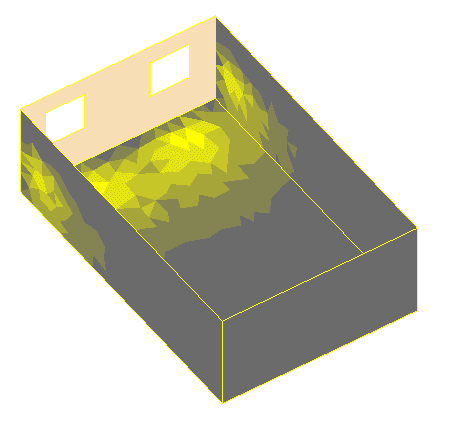
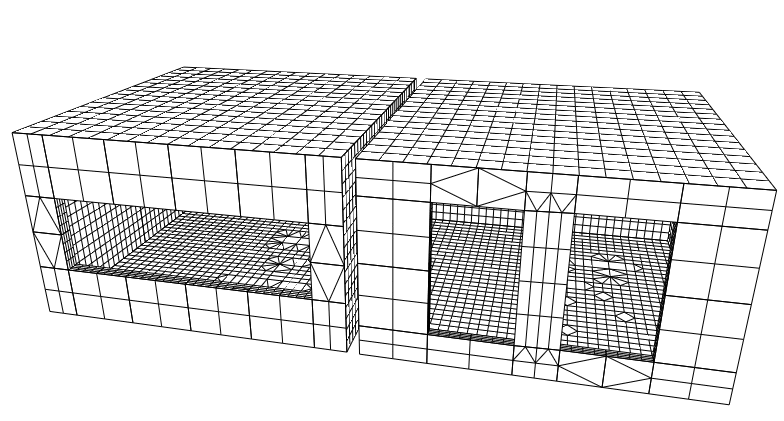
| The model built for the experiment is a group of two pavilions, one pierced by a strip window, the other by two vertical openings. The opening surfaces are equal. The orientation of the buildings allows the morning sun to be received at about 45°, and the midday sun practically in the axis. ( Lightscape software ) | The simulation carried out here in winter at midday shows a near equivalence of the average illumination between the two rooms. On the other hand, for all other times of the day, the strip window solution shows a slight advantage. |
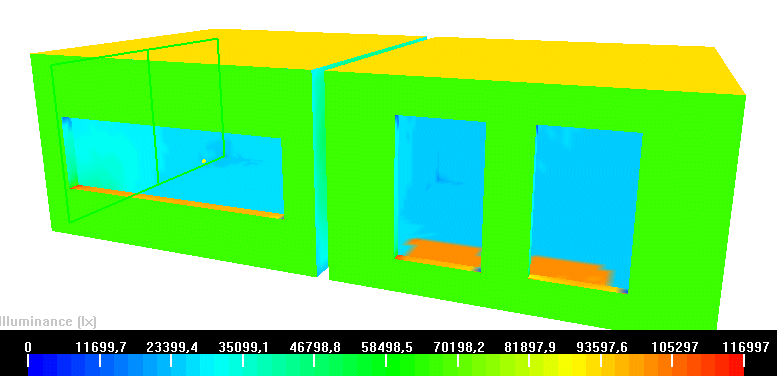 |
 |
| In summer at noon, the very high sun projects an extremely bright sunspot at the foot of the window. | Overall, the distribution is more homogeneous in the first case, strip window, in the second case, the areas are more contrasted. |
The strip window distributes the light more evenly, and the sensation of backlighting when looking towards the bay window is less noticeable. The stain on the ground is shallow and less intense. The light is captured better or for longer periods of time due to the sky factor seen. However, one detail should qualify the analysis.
 |
 |
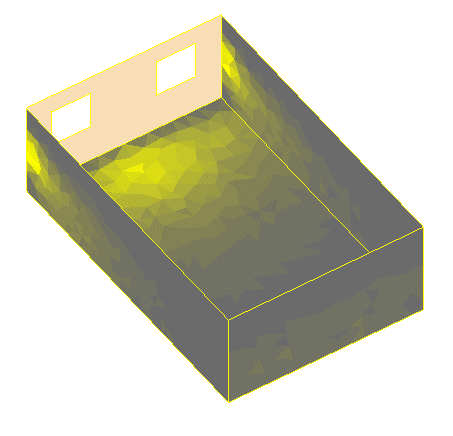
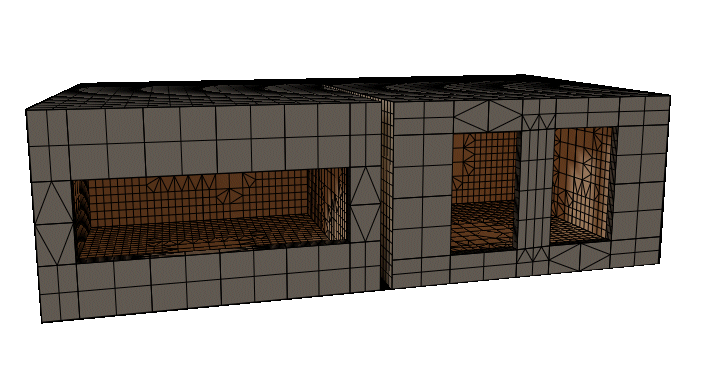
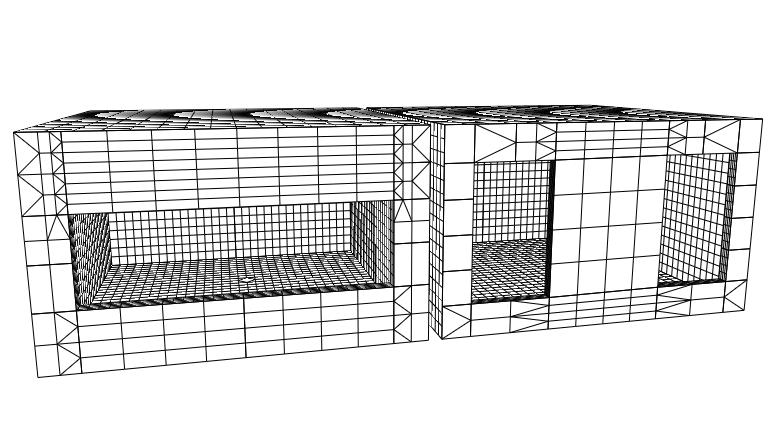
| In this model, the vertical bays offering the same opening surfaces as before have been placed close to the return walls. In this case, we observe better sunlight in the room for the high window than for the strip window. | |
In the case of the vertical window, the openings are concentrated in a central position, thus marking a large wall return. If we move the two bays apart to bring them closer to the perpendicular walls, we immediately obtain similar or even superior performance thanks to better reflection. Thus, it is not so much the shape of the opening that will play a role, but its position in relation to the other walls. A more detailed analysis would of course be necessary to determine the precise limits.
According to Vermeer (narrative speech)
Reducing the work of architecture to a simple exercise on the performance of this or that device would be rather regrettable. The vertical window, by giving the room stronger contrasts, gives it a great richness. The volume is better read (the homogeneous light flattens the volumes) or on the contrary, the dry rectangle can be transformed into a space whose contours appear mysterious. The argument of solar protection can hardly be retained in climates where the sun is only bothersome two months of the year.
The mullion, whose dark silhouette was criticized by Le Corbusier, does not have the strength that we would like to attribute to it. Its shadow does not form a black furrow in the floor, but disappears, absorbed by the force of the two luminous patches [7]. The high window requires a distribution of activities in the room, the intense light striking very close to the opening.
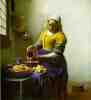
Vermeer (1632-1675) is in some ways an impressionist of interiors in that he observes with profound attention to detail the drawing of beings and objects under the light. His mastery of the subject is total.
![lttrmaid[1]](http://www.keris-studio.fr/blog/wp-content/lttrmaid1.jpeg) |
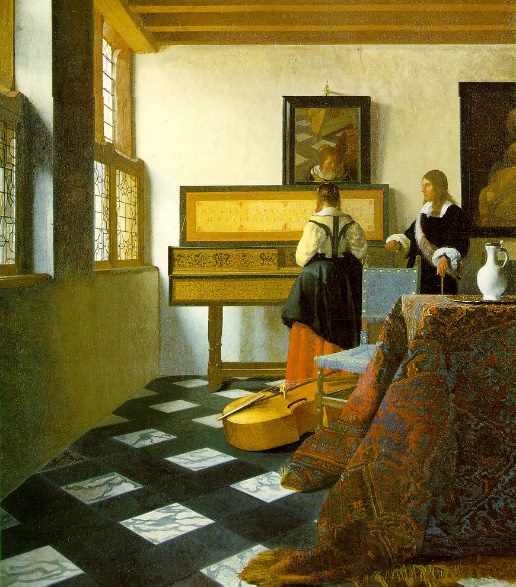 |
| Woman Writing and Her Servant , 1670-72 oil on canvas, 71.1 x 58.4 cm, National Gallery of Ireland, Dublin | The Couple at the Spinet , 1662-65, oil on canvas, 74.6 x 64.1 cm; Royal Collection, St. James’ Palace, London |
Less spectacular than the Le Nain brothers (Antoine (c. 1588-1648), Louis (c. 1593-1648) and Mathieu (c. 1607-1677)) and especially Georges de la Tour (1593-1653), Vermeer seeks the effect of light. He does not paint the object, but the play of light on the object. We will find the same preoccupation in Monet, and the other Impressionists from the outside.
 |
 |
 |
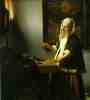 |
| The Horseman and the Laughing Girl , 1658, oil on canvas, 49.2 x 44.4 cm; The Frick Collection, New York | The Concert , 1665-66 oil on canvas, 72.5 x 64.7 cm; Isabella Stewart Gardner Museum, Boston | The Milkmaid , 1658-60, oil on canvas, 45.4 x 41 cm; Rijksmuseum , Amsterdam | The Pearl Weigher , 1662-64 oil on canvas, 42.5 x 38 cm; National Gallery of Art, Washington, DC |
| The magic of light in Vermeer. Coming from the left, Vermeer often painted in the same place, the morning light dazzles the surface of the canvas. The very high openings start from the perpendicular walls, but are often obscured by heavy curtains. Vermeer’s work with light is extremely precise. He uses a camera obscura, a sort of film-free camera, which allows him to capture the slightest glimmer of light. | |||
The light always comes from the left, it is a morning light, a little cold, which forms, according to the art critic Kenneth Klarck , a harmony » on blue, gray, white and pale yellow, lit by a window facing north . » [8]But it is rather an oriental light that characterizes the Flemish School. The light arrives through large, very high bays, divided into modules each bearing a wooden shutter. Filtering is thus easy. The figures place themselves very close to the openings, and carry out their activities there.
Grasshopper simulation
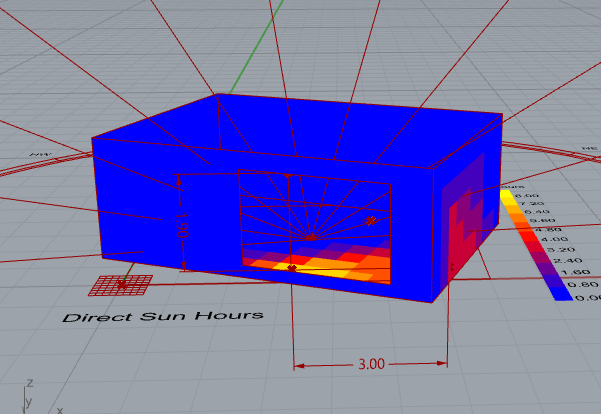
Analyzing Window Size & Orientation for Solar Radiation using Ladybug
1. Overall Goal & Core Concept
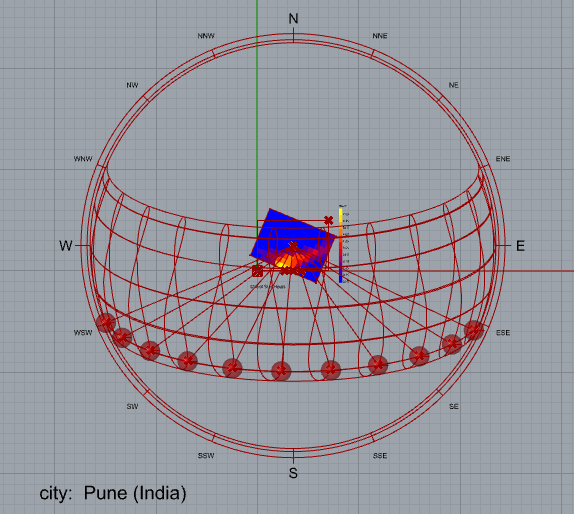
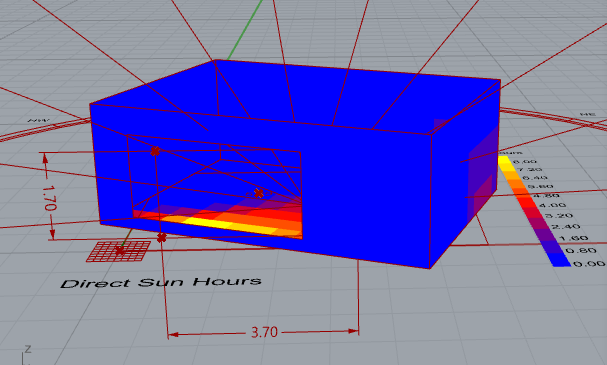
This definition is designed to analyze how much solar radiation is incident on the exterior surface of a window in Pune, India, over a specific period. By parametrically adjusting the window’s size and the facade’s orientation, you can find a design that minimizes direct solar exposure and potential heat gain.
The core concept is to:
- Parametrically model a window surface and its surrounding context (a wall).
- Use a Ladybug weather file (.epw) for Pune to get accurate local solar data.
- Run a direct radiation analysis on the window geometry, considering any shading from the wall.
- Visualize the results as a colored heat map to easily interpret the data.
2. Prerequisites
- Rhino & Grasshopper: A working installation.
- Ladybug Tools plugin: This definition requires the Ladybug part of the Ladybug Tools plugin.
- EnergyPlus Weather File (.epw): You need an .epw file for Pune, India. These can be downloaded for free from the EPWMap.
Step-by-Step Breakdown
The script is organized into four main parts from left to right:
Part 1: Parametric Geometry (The Analysis & Context Surfaces)
This initial section (the light-pink group on the left) creates the 3D geometry that will be analyzed.
- Context Geometry (The Wall): The components in the top-left green group create the surface that will act as shading context. This is likely a single, large rectangular surface representing the building facade.
- Analysis Geometry (The Window): A separate set of components creates the window. Number Sliders are used to control its width and height. Another slider likely controls its position on the wall. This surface is the primary geometry we want to analyze.
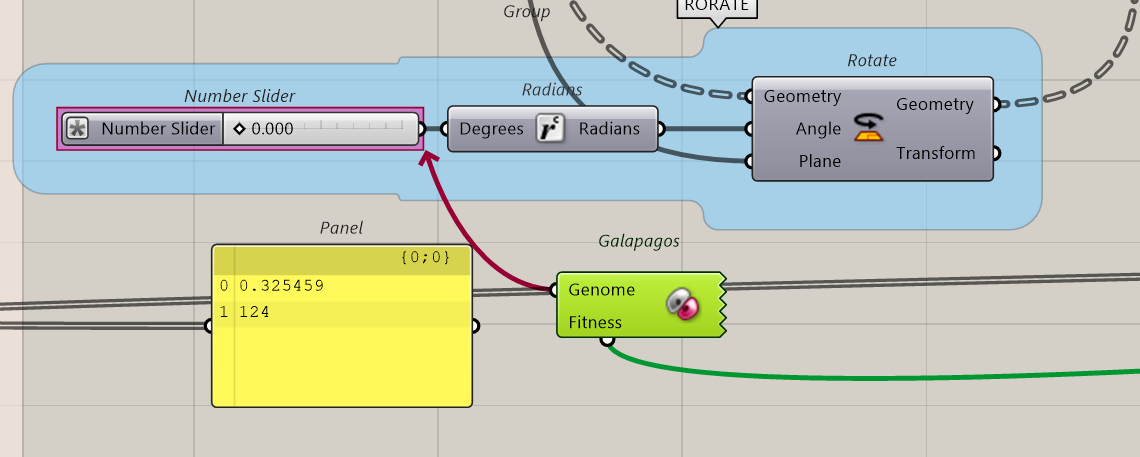
- Orientation Control: A Rotate component is used to orient the entire model (wall and window together). This is controlled by a Number Slider (from 0 to 360 degrees) that lets you test different facade orientations (facing North, South, East, West, etc.).
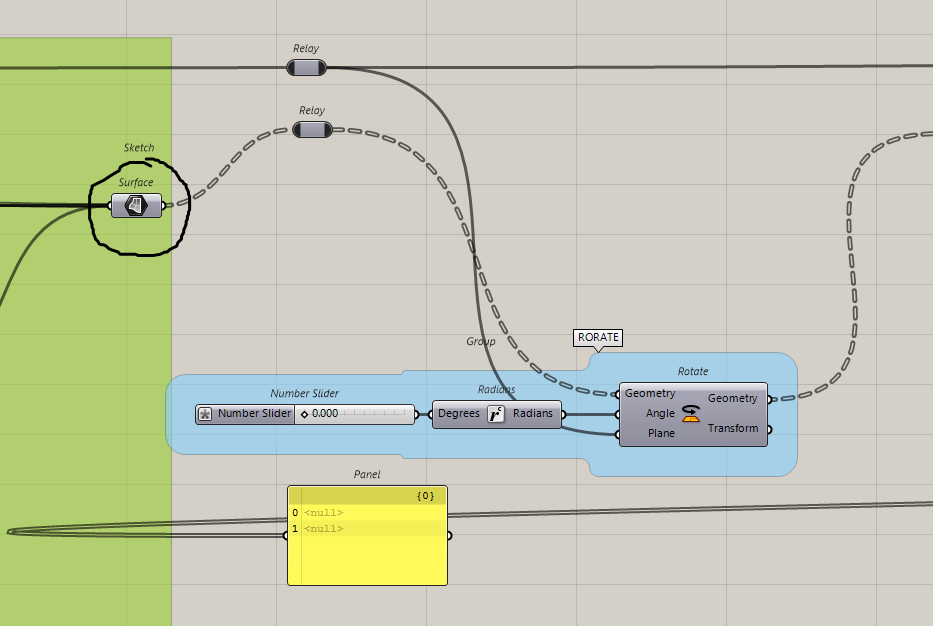
Output of Part 1: Two key pieces of geometry: the _context surface (the wall) and the _geometry to be analyzed (the window).
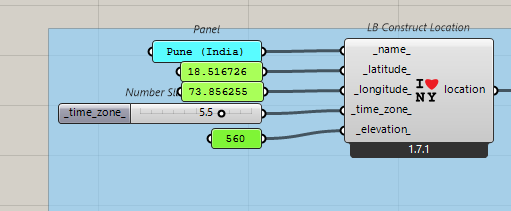
Part 2: Setting up the Ladybug Environment
This section loads the necessary environmental data for the simulation.
- Load Weather File: The Ladybug_Import EPW component is used here. You must connect a File Path component containing the location of your Pune .epw weather file to its _epwFile input. This component extracts location data, sun positions, and radiation values for the entire year.
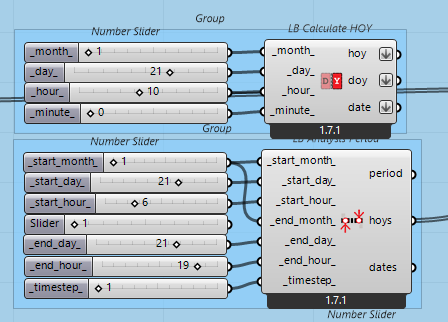
- Select Analysis Period: The Ladybug_Analysis Period component allows you to define the time of year for the study. For an annual analysis, it would be left at the default (Jan 1st to Dec 31st). You could also set it to analyze only the hottest summer months, for example.
Part 3: Running the Solar Radiation Analysis
This is the core analysis engine of the definition.
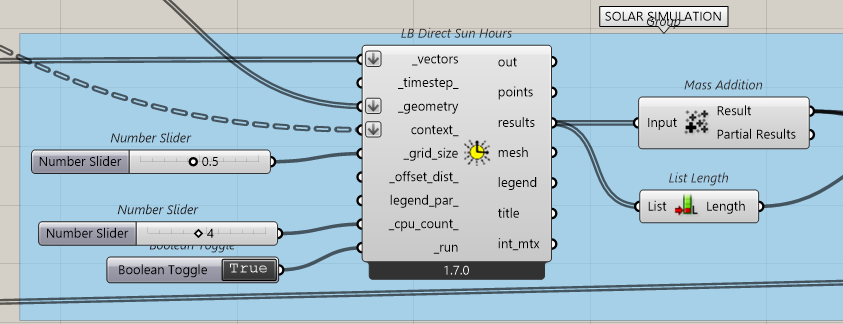
- Ladybug Radiation Analysis Component: This is the main component in the script, likely Ladybug_Radiation Analysis or Ladybug_Incident Radiation. It takes several key inputs:
- _geometry: The window surface from Part 1 is connected here.
- _context: The wall surface from Part 1 is connected here to act as shading.
- _location: where the simulation is located.
- _analysisPeriod: The output from the Analysis Period component is connected here to specify the simulation time frame.
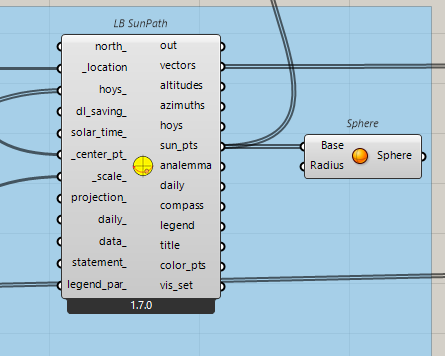
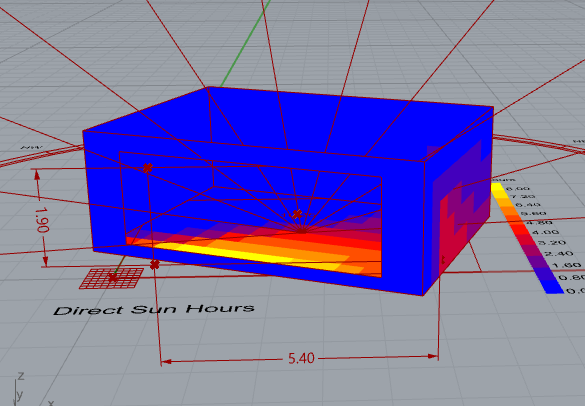
- Calculation: This component calculates the cumulative solar radiation in kilowatt-hours per square meter (kWh/m2) that strikes each point on the analysis _geometry (the window) during the specified period.
Output of Part 3: A list of numbers (results) representing the radiation values for the window.
Part 4: Visualizing the Results
This final section turns the raw data into an intuitive visual graphic.
- Legend Parameters: The Ladybug_Legend Parameters component sets up the color range and labels for the visualization. You can define the title of the legend and the min/max values of the data range.
- Recolor Mesh: The Ladybug_Recolor Mesh component is the final step. It takes the _geometry (the window), the results from the radiation analysis, and the _legendPar as inputs. It then colors the window surface based on the radiation values, creating the final « heat map » visualization.
How to Use and Interpret the Results
- Control the Parametric Inputs: Go back to the Number Sliders in Part 1.
- Change the window size sliders to see how making the window larger or smaller impacts the total solar energy it receives.
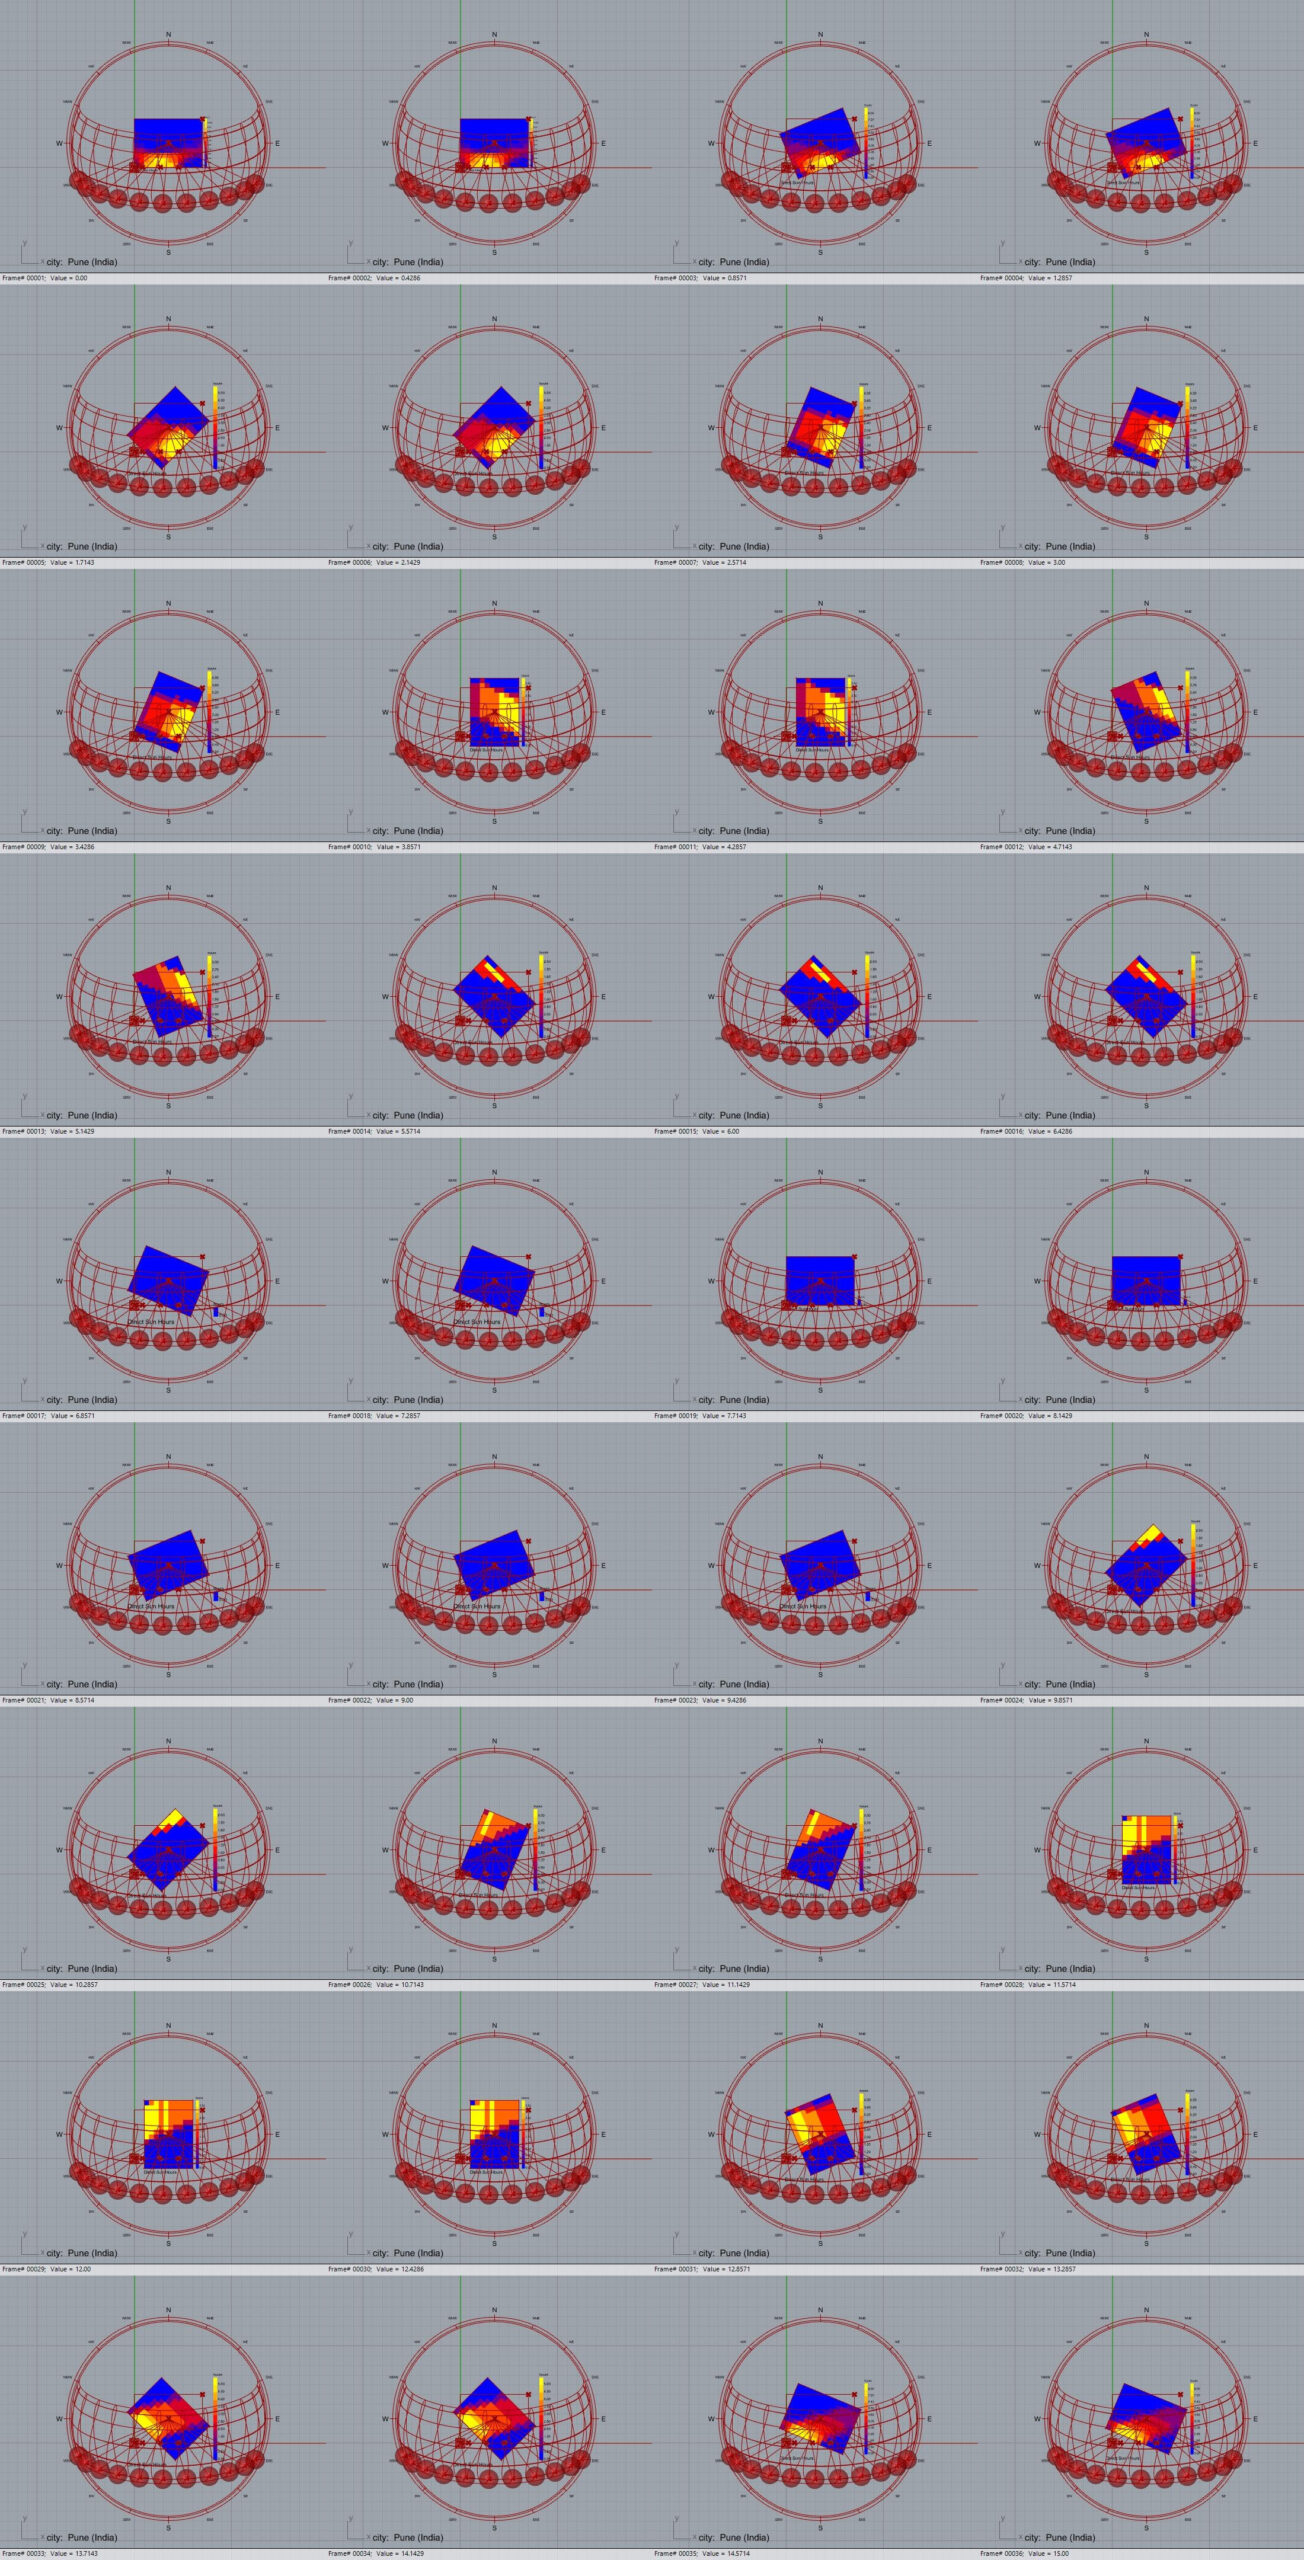
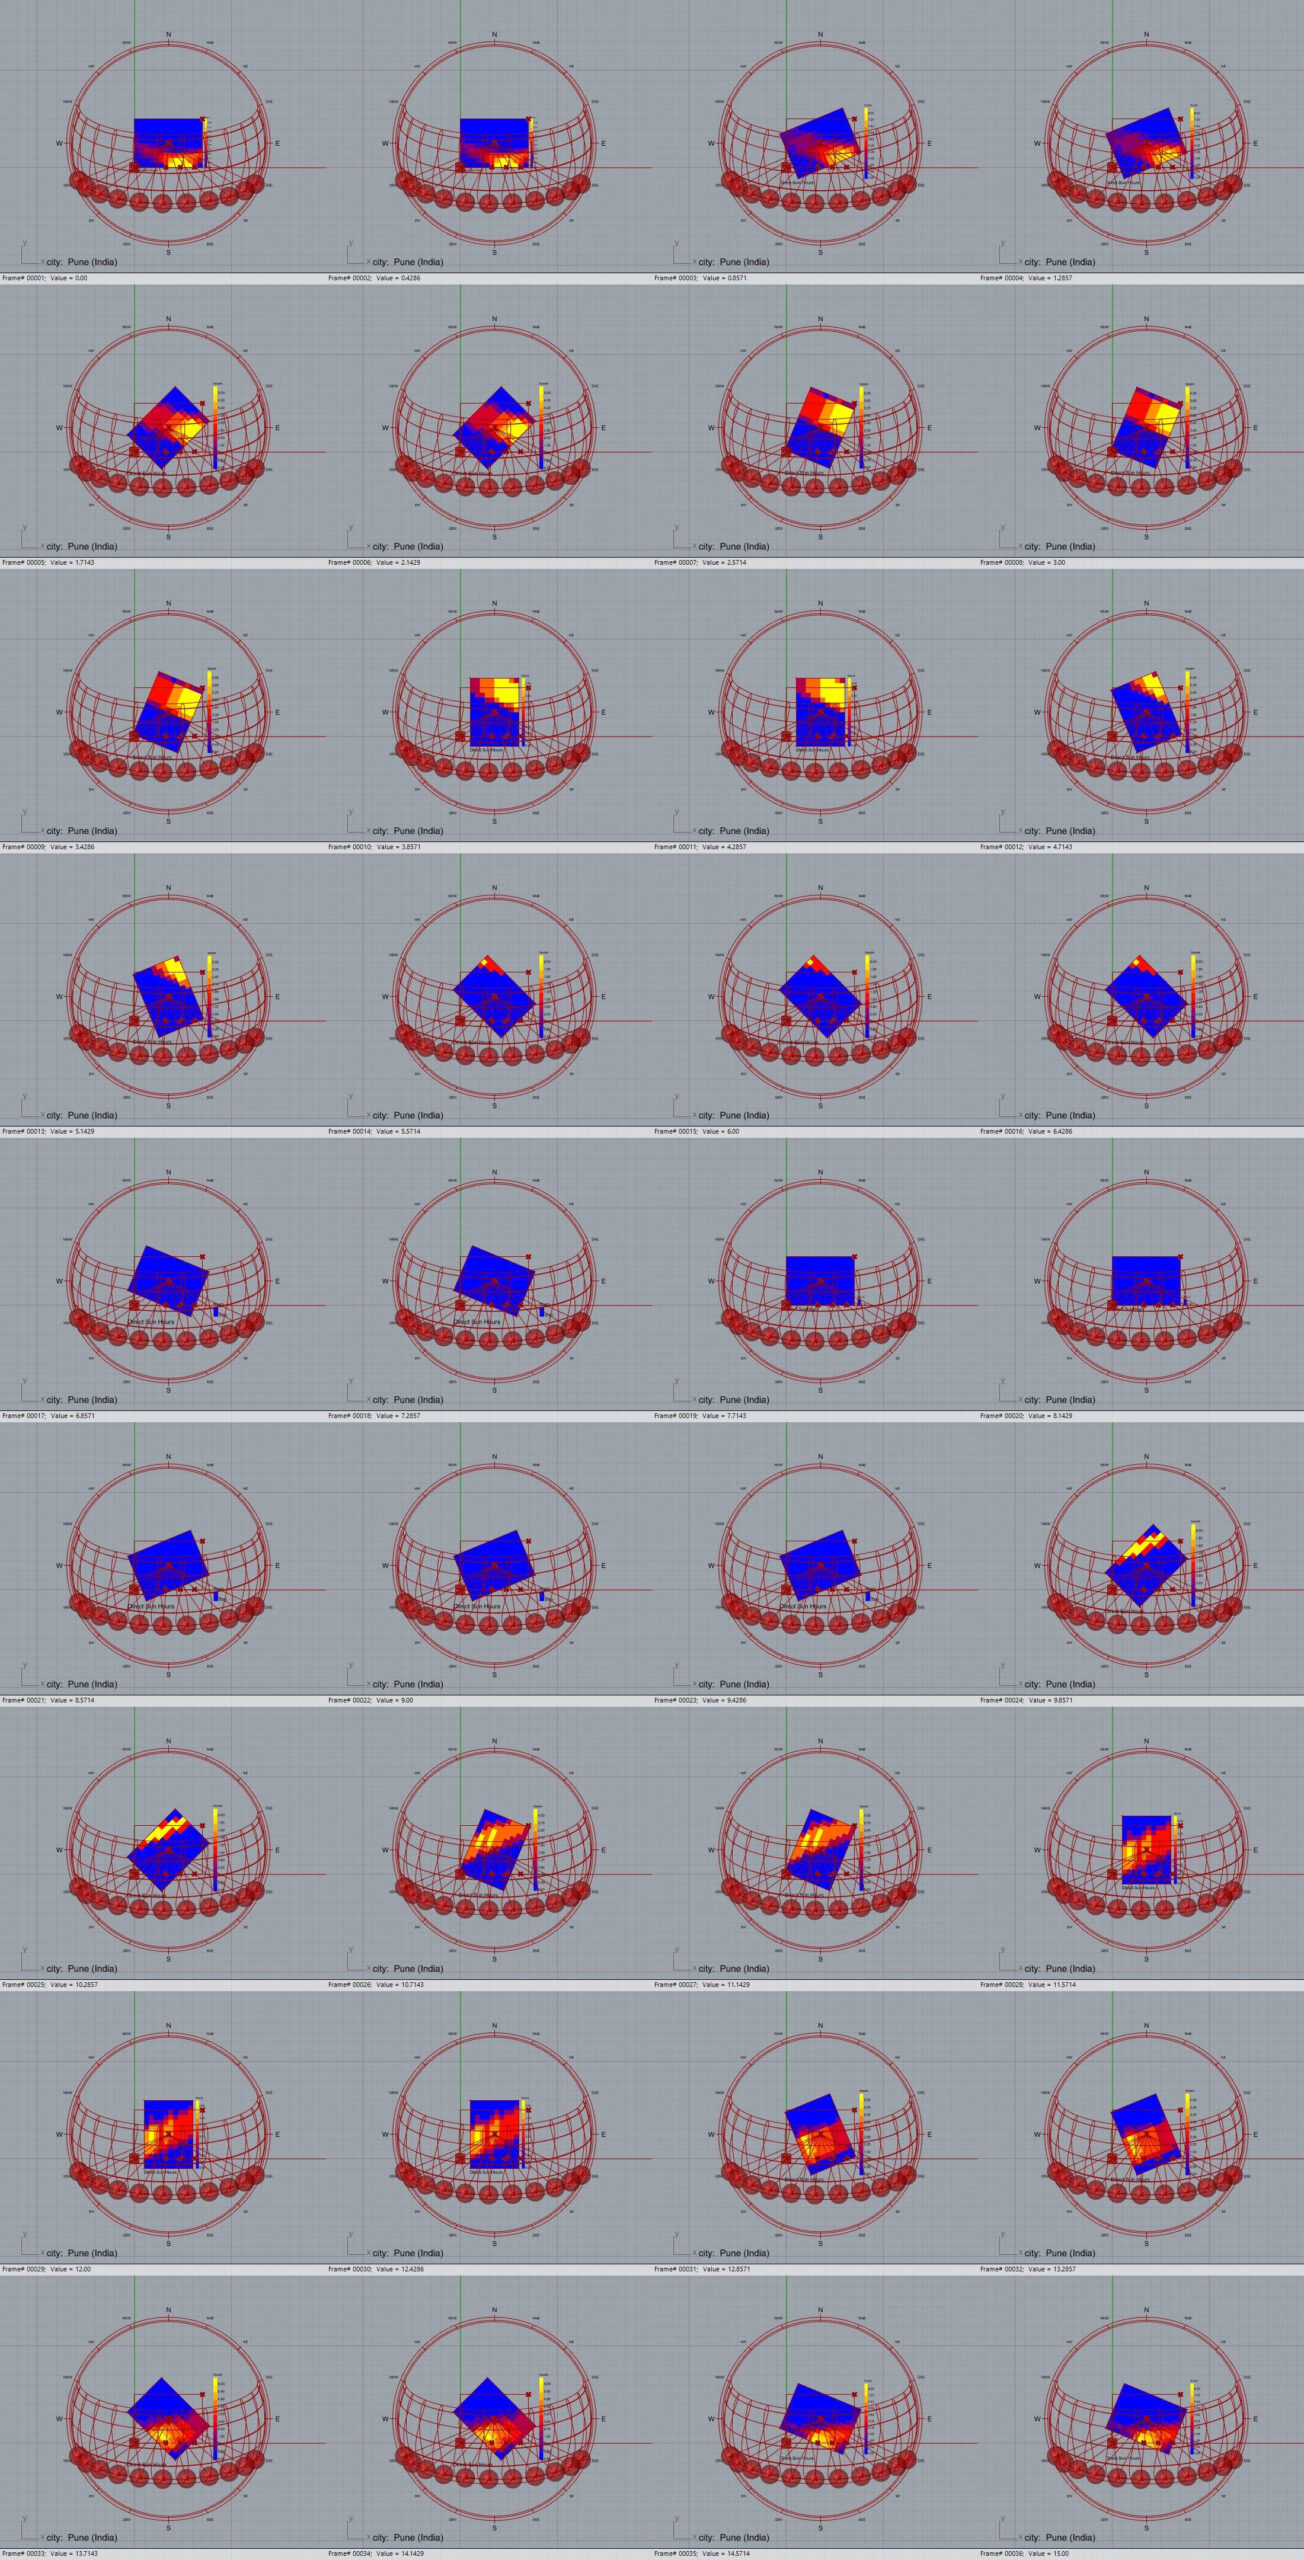
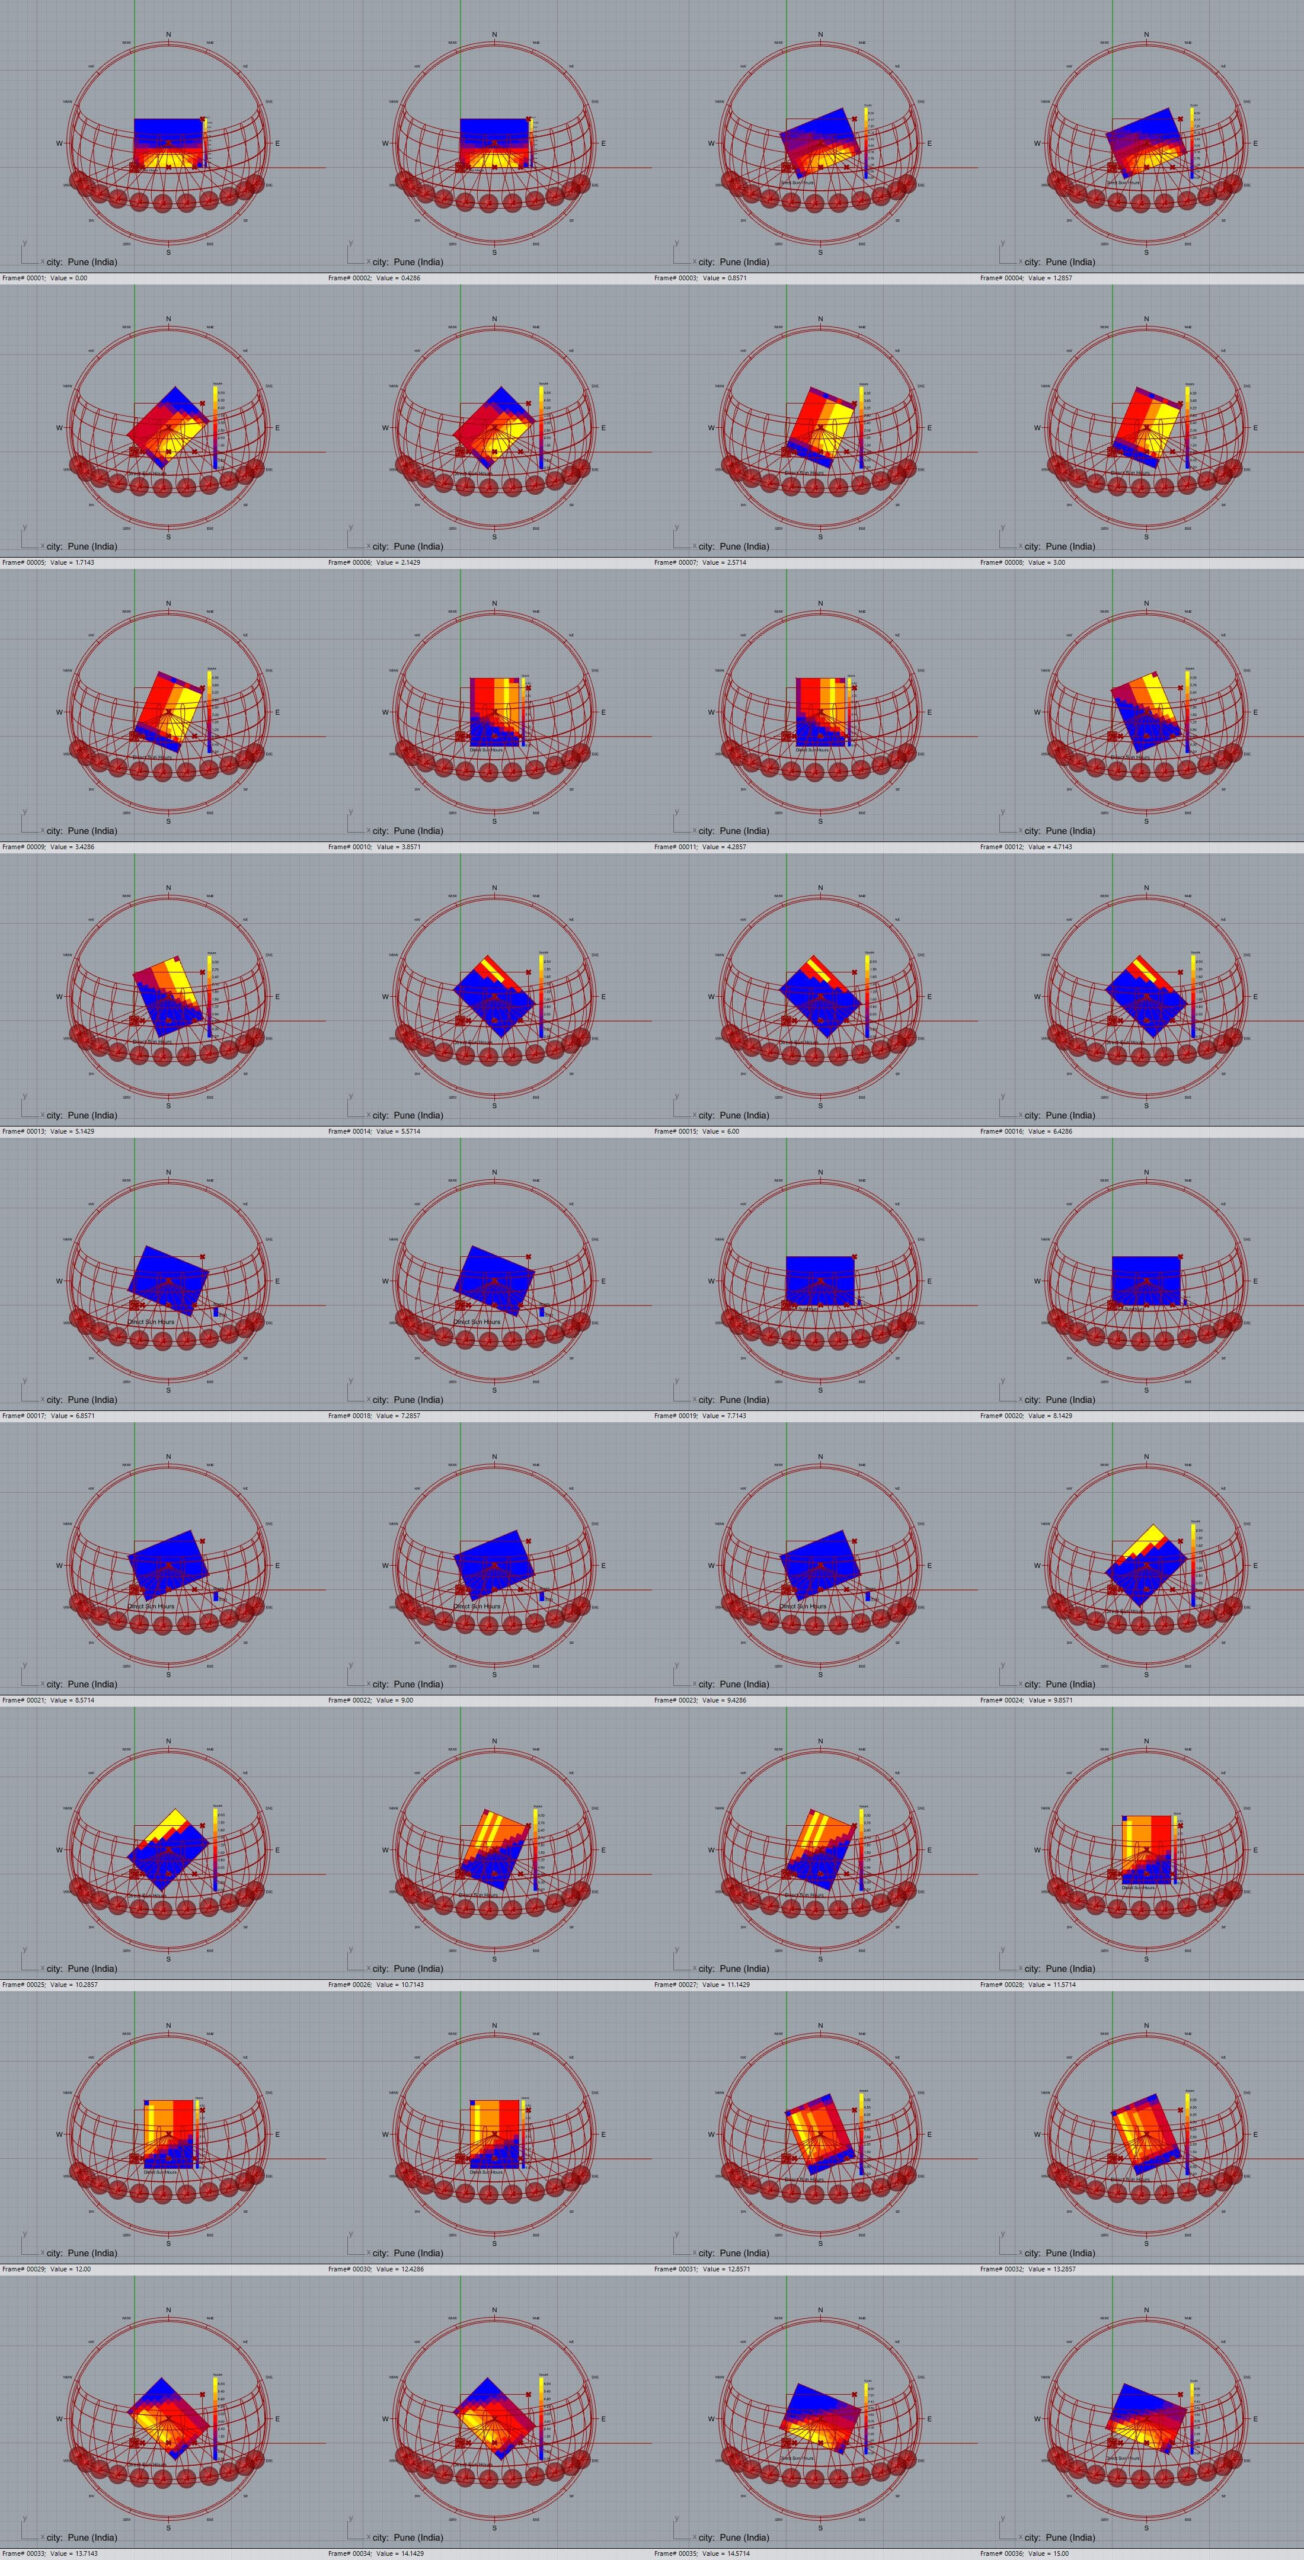
- Adjust the orientation slider to simulate rotating the facade. Observe how the solar radiation pattern and intensity change as the window faces different directions.
- Analyze the Visual Output:
- The Legend: The legend on your screen is the key to understanding the colors. It shows the value of solar radiation in kWh/m2 corresponding to each color.
- For Pune (a hot climate): The primary goal is usually to minimize solar radiation to reduce the amount of heat entering the building and thus lower the need for air conditioning. A « better » design in this context is one that shows cooler colors (blue/green), indicating lower radiation values.
- By testing different orientations and sizes, you can find a combination that provides daylight without receiving excessive, direct solar energy, leading to a more comfortable and energy-efficient building design.
Part 5: Optimization with Galapagos to Find the Best Orientation
Once the analysis is set up, you can manually change the sliders to see the results. However, this can be time-consuming. We can use Grasshopper’s built-in optimization component, Galapagos, to automatically test hundreds of orientations and find the one that best meets our goal.
The Concept: Galapagos works like natural selection. It requires:
- A Genome: The parameter(s) it is allowed to change (in our case, the orientation Number Slider).
- A Fitness Value: A single number that defines how « good » a solution is. Our goal is to minimize the total solar radiation.

Step 5.1: Defining the Fitness Value (The Goal)
The Ladybug_Radiation Analysis component outputs a list of radiation values for every point on the window. Galapagos needs a single numerical goal. We will calculate the total solar radiation by summing all of these values.
- Add a Mass Addition component to your canvas (found under Maths > Operators).
- Connect the results output from your Ladybug_Radiation Analysis component into the numbers (D) input of the Mass Addition component.
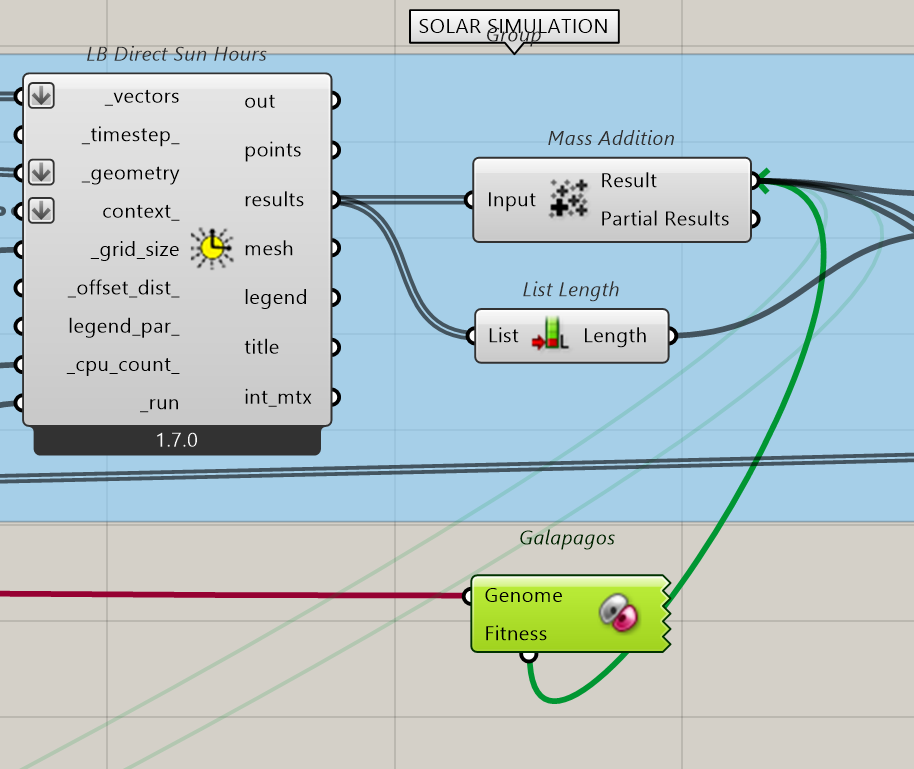
The Result (R) output of this component is now a single number representing the total solar energy in kWh hitting the window over the year. This will be our Fitness value.
Step 5.2: Setting Up the Galapagos Solver
- Add the Galapagos component to the canvas. You can find it under Params > Util. It is a small, black component with no inputs or outputs on its face.
- Connect the Number Slider that controls your orientation (the one connected to the Rotate component from Part 1) to the Genome (G) input of the Galapagos component.
- Connect the Result (R) output from your Mass Addition component to the Fitness (F) input of the Galapagos component.
Your canvas should now look something like this, with the new components added:
!(https.i.imgur.com/example-image-with-galapagos.png) (This is a conceptual image showing the connections)
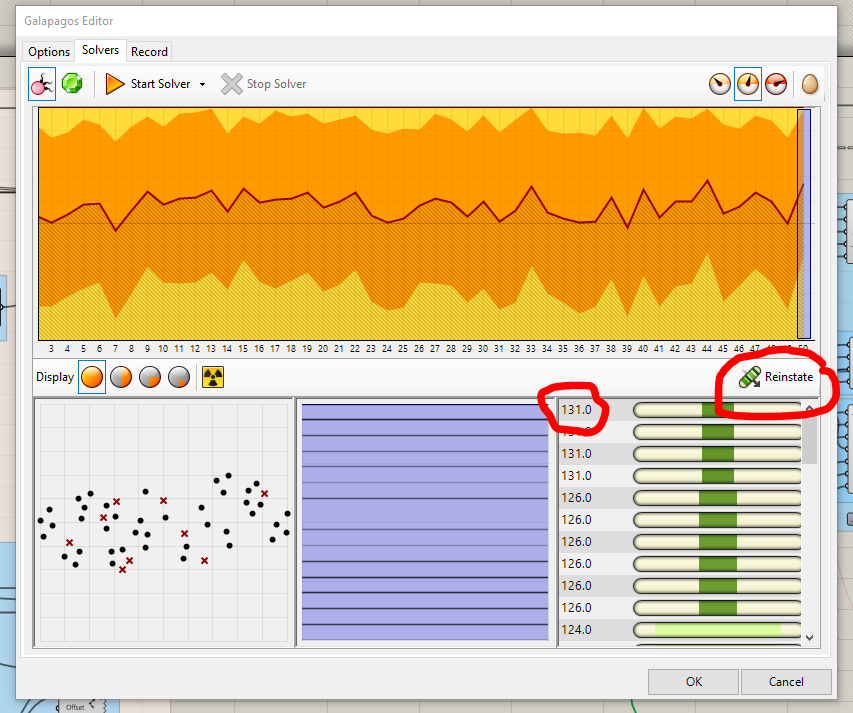
Step 5.3: Running the Optimization
- Double-click the Galapagos component to open the solver window.
- Go to the first tab, « Fitness ». Here, you must tell Galapagos what its goal is. Since we want to reduce heat gain in a hot climate like Pune, set the goal to « Minimize ».
- Go to the second tab, « Solvers ». You will see two main solvers. The default « Evolutionary Solver » is a good starting point.
- Click « Start Solver ».
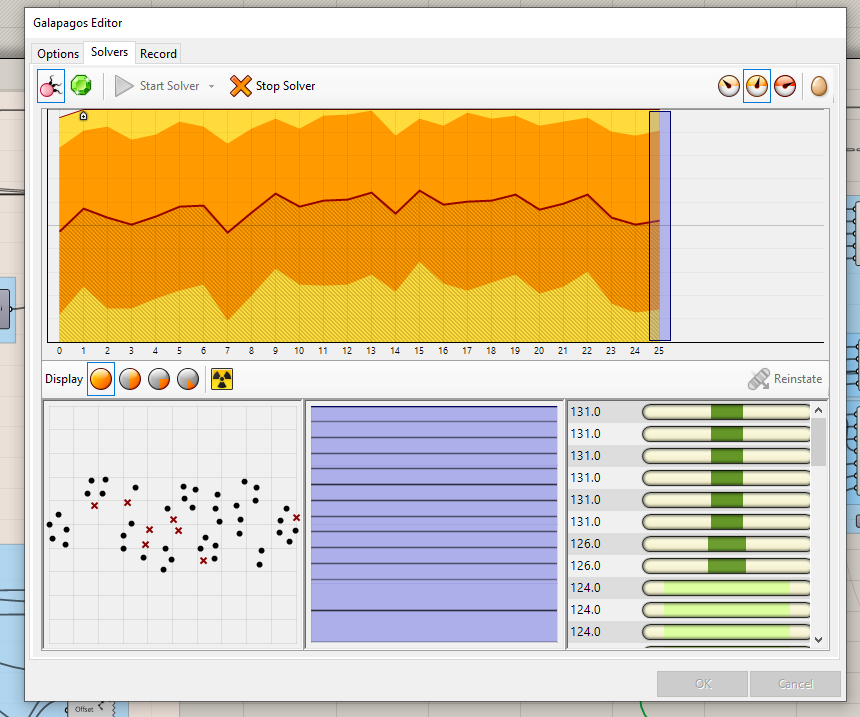
Galapagos will now take control of your orientation slider. You will see the geometry in your Rhino viewport rapidly changing orientation as the solver tests different solutions. The Galapagos window will display graphs showing the best and average solutions it finds in each generation.
Let the solver run for several minutes. As it progresses, the « Best » result will plateau, meaning it has likely found a near-optimal solution. You can then stop the solver, select the best option it found from the list, and click « OK » to reinstate that value in your orientation slider.
Detailed Briefing Document: Window Design and Atmospheric Representation
This briefing document synthesizes key themes and facts from the provided sources concerning window design, atmospheric representation in architecture, and computational simulation for performance analysis.
Main Themes:
- The Evolution and Impact of Window Types: The sources highlight a historical progression from horizontal/strip windows (Middle Ages) to vertical Renaissance windows, and then to the modern « ribon window » championed by Le Corbusier. The choice of window type significantly impacts light distribution, visual perception, and the overall atmosphere of an interior space.
- Multifaceted Representation of Atmosphere: The concept of « representation of atmospheres » is explored through various lenses:
- Discourse: Architectural discourse (e.g., injunctive, argumentative, descriptive, narrative speech) influences how window characteristics are understood and promoted.
- Drawing/Diagrams: Visual representations, from historical diagrams to Le Corbusier’s sketches, are crucial for conveying ideas about light and space.
- Perception: User perception and the subjective experience of light and space are emphasized, often diverging from purely objective measurements.
- Simulation: Computational tools are increasingly used to objectively quantify and visualize environmental performance.
- The Debate Between Subjectivity and Objectivity in Design: The documents showcase a tension between artistic and experiential interpretations of light (Vermeer’s narrative, Le Corbusier’s observations) and scientific, quantitative analyses (LUX magazine study, Grasshopper/Ladybug simulations).
- Computational Design and Optimization (Grasshopper/Ladybug/Galapagos): Modern tools allow for parametric modeling, detailed environmental analysis (solar radiation), and automated optimization to achieve specific performance goals, such as minimizing heat gain.
Most Important Ideas or Facts:
1. Historical Context and Window Evolution (ribon-window.pdf)
- Doyon and Hubrecht (Injunctive Speech): Recount the shift from horizontal medieval windows to vertical Renaissance windows, attributing it to « the evolution of masonry techniques. » They emphasize the importance of high windows for proper lighting (« daylight falls from above ») and ventilation. Their diagram illustrates more homogeneous light from strip windows, but arriving low, versus the Renaissance window’s ability to illuminate « higher and deeper » despite more pronounced dark areas.
- Le Corbusier (Argumentative Speech): Strongly advocates for the « ribon window, » claiming it « illuminates better than the high windows. » He cites « sensitive photographic film » as empirical proof, stating that with equal glass surface, a room with a ribon window has « two lighting zones: a zone 1, very lit; a well-lit zone 2, » compared to vertical windows creating « four lighting zones » with larger poorly lit or dark sectors. He provocatively concludes, « The sensitive film has spoken. Ergo! »
2. Scientific Analysis of Light Distribution (ribon-window.pdf)
- LUX Magazine Study (1983 – Descriptive Speech): This study measured light in rooms with different window types.
- Findings: While broadly aligning with Le Corbusier’s principles, the study found that the « difference (4 times!!) announced is certainly not in the same proportions. » Notably, « the back of the room is better lit in the case of the vertical window. »
- Quantitative Measures: The study uses physical quantities like Lumen (lm) for flux, cd/m² (nit) for Luminance, lux (lm/m²) for Illumination, and W/sr (candela) for Intensity to measure light.
- Numerical Simulation (Solène & Lightscape Software):Equal Opening Surfaces: Simulations were performed comparing strip windows and two vertical openings with equal opening surfaces.
- Winter Midday: « shows a near equivalence of the average illumination between the two rooms. »
- Other Times/Overall: « for all other times of the day, the strip window solution shows a slight advantage. Overall, the distribution is more homogeneous in the first case, strip window. »
- Impact of Position: A crucial finding is that « it is not so much the shape of the opening that will play a role, but its position in relation to the other walls. » Vertical bays placed closer to « perpendicular walls » can achieve « similar or even superior performance thanks to better reflection. »
3. Artistic and Experiential Perspective (ribon-window.pdf)
- Vermeer (Narrative Speech): Argues against reducing architecture to performance metrics.
- Value of Contrast: « The vertical window, by giving the room stronger contrasts, gives it a great richness. The volume is better read. » This contrasts with homogeneous light which « flattens the volumes. »
- Mullion’s Role: The « mullion, » criticized by Le Corbusier, is seen as not casting a significant shadow, but rather disappearing « absorbed by the force of the two luminous patches. »
- Vermeer’s Technique: He is described as an « impressionist of interiors » who observes the « play of light on the object. » His works often depict light coming « from the left, it is a morning light, a little cold, » arriving through « large, very high bays, divided into modules. » He used a « camera obscura » to capture subtle light.
4. Computational Design Workflow with Grasshopper/Ladybug/Galapagos (definition.pdf & ribon-window.pdf)
- Overall Goal: To « analyze how much solar radiation is incident on the exterior surface of a window » and find a design that « minimizes direct solar exposure and potential heat gain. »
- Core Concept: Parametrically model window/wall, use a weather file (e.g., Pune .epw), run direct radiation analysis considering shading, and visualize results as a heat map.
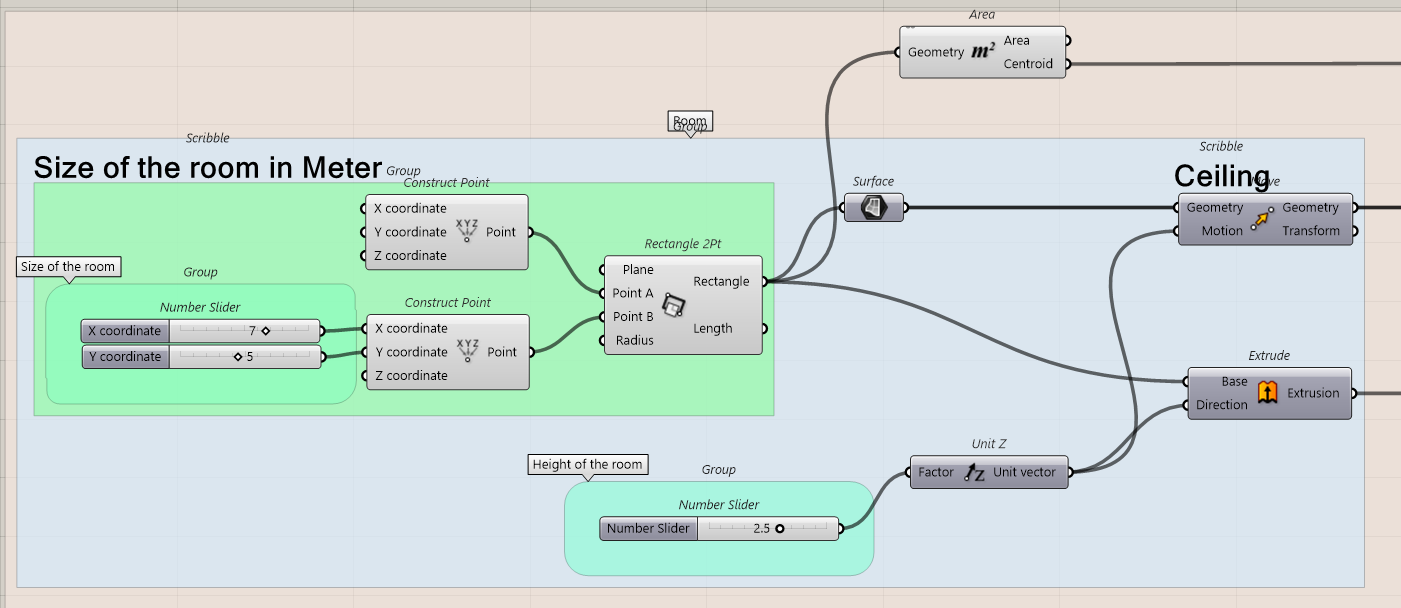
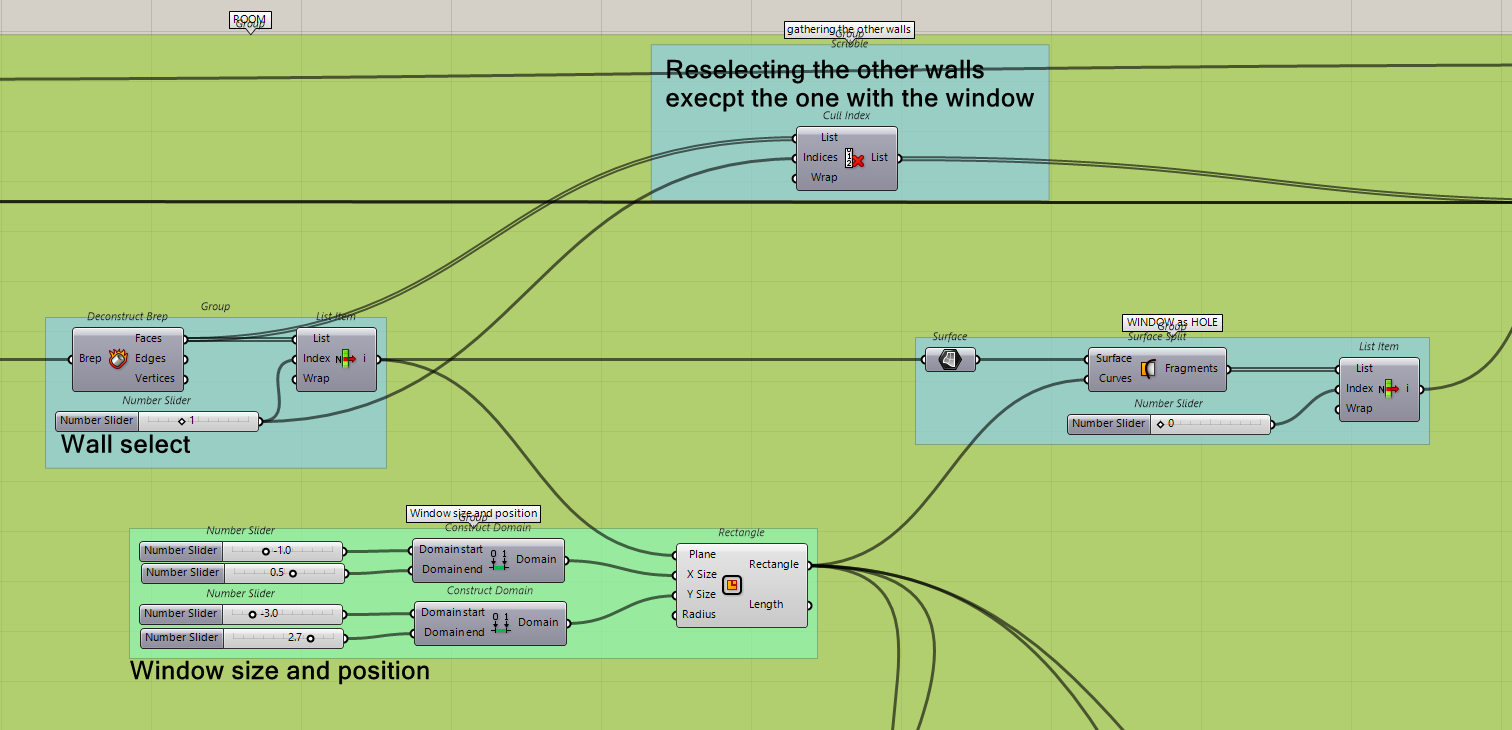
- Step-by-Step Breakdown (referencing definition.pdf diagram):Part 1: Parametric Geometry (Light-pink group): Creates the _context (wall) and _geometry (window) surfaces. « Number Sliders are used to control its width and height » and Rotate component controls facade orientation.
- Part 2: Setting up Ladybug Environment (Yellow group): Ladybug_Import EPW loads weather data for the specified location (Pune). Ladybug_Analysis Period defines the simulation timeframe.
- Part 3: Running Solar Radiation Analysis (Blue group): The main Ladybug_Radiation Analysis (or Ladybug_Incident Radiation) component takes _geometry, _context, _location, and _analysisPeriod as inputs. It calculates « cumulative solar radiation in kilowatt-hours per square meter (kWh/m2). »
- Part 4: Visualizing Results (Right-most blue group): Ladybug_Legend Parameters sets up the legend, and Ladybug_Recolor Mesh colors the window surface based on radiation values, creating the « heat map » visualization. In hot climates, « cooler colors (blue/green) » indicate lower, more desirable radiation values.
- Optimization with Galapagos:Purpose: Automates the search for an optimal design (e.g., best orientation) by testing numerous solutions.
- How it Works: Requires a « Genome » (the parameter to change, e.g., orientation slider) and a « Fitness Value » (a single number representing how « good » a solution is).
- Defining Fitness Value: For minimizing solar radiation, the sum of all radiation values from the Ladybug_Radiation Analysis (calculated via a Mass Addition component) serves as the Fitness value.
- Galapagos Setup: Connect the orientation slider to the Genome (G) input and the total solar radiation result to the Fitness (F) input. Set the goal to « Minimize. »
This comprehensive approach allows designers to move beyond purely qualitative discussions to quantitatively assess and optimize architectural elements for environmental performance while still acknowledging the importance of subjective experience and artistic expression.

Comprehensive Study Guide: Window Design and Performance Analysis
This study guide is designed to test your understanding of architectural window design, its historical context, and modern simulation techniques.
I. Quiz: Short Answer Questions
Answer each question in 2-3 sentences.
- Doyon and Hubrecht’s View on Window Evolution: According to Doyon and Hubrecht, what was the primary driver behind the transition from horizontal medieval windows to vertical Renaissance windows? How did this evolution impact the light distribution in a room?
- Le Corbusier’s Argument for the Ribon Window: What was Le Corbusier’s main argument in favor of the ribon window over the tall Renaissance window? What evidence did he present to support his claims, and why was it considered provocative?
- Limitations of Sketching in Window Analysis: Why is sketching considered insufficient for an exact account of window qualities, according to the source material? What is suggested as a more accurate approach?
- Purpose of the LUX Magazine Study (1983): What was the primary objective of the comprehensive study presented in LUX magazine in 1983 regarding window performance? How were the results expressed and interpreted?
- Impact of Window Position on Light Distribution: The simulations suggest that the shape of the opening is not the sole factor in light distribution. What other crucial element is highlighted, and how does its adjustment affect a room’s sunlight?
- Vermeer’s Perspective on Vertical Windows: How does Vermeer’s work challenge the notion that homogeneous light is always preferable in architectural spaces? What artistic qualities does he emphasize that are enhanced by vertical windows?
- Role of the Grasshopper « Ladybug Tools » Plugin: What is the primary function of the Ladybug Tools plugin within the Grasshopper simulation described? What kind of data does it utilize for its analysis?
- Context and Analysis Geometry in Grasshopper Simulation: In the Grasshopper definition, what do the « context geometry » and « analysis geometry » represent? What is the significance of distinguishing between these two in the simulation?
- Purpose of the « Analysis Period » Component in Ladybug: Why is the Ladybug_Analysis Period component crucial in setting up a solar radiation analysis? How does it allow for flexibility in the simulation?
- Galapagos Optimization in Grasshopper: Explain the purpose of using the Galapagos component in the Grasshopper simulation. What are the two main inputs required for Galapagos to function effectively in this context?
II. Answer Key (Quiz)
- Doyon and Hubrecht’s View on Window Evolution: Doyon and Hubrecht attribute the transition to vertical Renaissance windows primarily to advancements in masonry techniques, allowing for taller constructions. This evolution resulted in light arriving from higher up, illuminating the room higher and deeper, though with more pronounced dark areas compared to strip windows.
- Le Corbusier’s Argument for the Ribon Window: Le Corbusier argued that the ribon window illuminated better than high windows, basing his claim on « sensitive photographic film » simulations rather than just personal observations. His discourse was considered provocative and polemical, challenging conventional architectural views and inviting scientific verification.
- Limitations of Sketching in Window Analysis: Sketching is deemed insufficient because it is necessarily partial and cannot give an exact account of the qualities of an opening. The text suggests that only a physical approach or numerical simulation will be able to provide precise and accurate data on window performance.
- Purpose of the LUX Magazine Study (1983): The LUX magazine study aimed to comprehensively measure light distribution in various room configurations with different window types. The results were expressed as a percentage of daylight factor on a horizontal plane, categorizing clarity from « Very weak » to « Very high » and providing insight into visual impressions and atmosphere.
- Impact of Window Position on Light Distribution: The text highlights that it is not so much the shape of the opening, but its position in relation to other walls, that plays a crucial role. Moving vertical bays closer to perpendicular walls can achieve similar or even superior performance due to better light reflection.
- Vermeer’s Perspective on Vertical Windows: Vermeer’s work suggests that vertical windows, by creating stronger contrasts and less homogeneous light, can give a room greater richness and better define volumes. He focuses on the play of light on objects, using the inherent contrasts of vertical openings to enhance the visual and atmospheric qualities of interior spaces.
- Role of the Grasshopper « Ladybug Tools » Plugin: The Ladybug Tools plugin is essential for environmental analysis, specifically for handling solar data and running radiation simulations. It imports EnergyPlus Weather files (.epw) to extract location data, sun positions, and radiation values, enabling accurate local solar analysis.
- Context and Analysis Geometry in Grasshopper Simulation: The « context geometry » represents the surrounding elements that might cast shade, such as the building facade or wall. The « analysis geometry » is the specific element whose performance is being studied, in this case, the window surface. This distinction allows the simulation to accurately account for shading effects.
- Purpose of the « Analysis Period » Component in Ladybug: The Ladybug_Analysis Period component allows users to define the specific time frame for the study, from a full year to particular months or even days. This flexibility is crucial for tailoring the analysis to different design goals, such as minimizing heat gain during summer or maximizing daylight in winter.
- Galapagos Optimization in Grasshopper: Galapagos is used to automatically find the optimal solution by testing numerous parameter combinations, rather than manual adjustment. It requires a « Genome » (the parameter(s) to be changed, like window orientation) and a « Fitness Value » (a single numerical goal, such as minimizing total solar radiation).
III. Essay Format Questions
- Compare and contrast the arguments presented by Doyon and Hubrecht, Le Corbusier, and the 1983 LUX magazine study regarding the optimal window type and its impact on interior light. Discuss how their methodologies (historical observation, personal observation/simulation, scientific measurement) influence their conclusions.
- Analyze how the concept of « representation » is explored through the example of the « ribon window » in the text. Discuss how different forms of discourse (injunctive, argumentative, descriptive, narrative) contribute to or complicate the understanding of architectural atmospheres.
- Discuss the evolution of tools and methodologies for analyzing window performance, as presented in the source material. How do traditional observations and artistic interpretations differ from and complement modern computational simulations like those using Ladybug/Grasshopper?
- Examine the relationship between architectural discourse, realization, and user perception as exemplified by the ribon window. How does Le Corbusier’s polemical stance and the subsequent scientific verifications highlight the gap that can occur between these three aspects?
- Based on the Grasshopper simulation description, explain how parametric design and optimization tools like Galapagos can aid in achieving specific environmental performance goals in architecture. Use the example of minimizing solar radiation in Pune to illustrate the process and benefits.
IV. Glossary of Key Terms
- Ribon Window: A long, horizontal window, often spanning the width of a facade, praised by Le Corbusier for its homogeneous light distribution. Also referred to as a « strip window » or « longitudinal window. »
- Vertical Window (Renaissance Type): A tall, often narrow window, characteristic of the Renaissance period, which Doyon and Hubrecht linked to advancements in masonry techniques.
- Architectural Discourse: The various ways in which architectural ideas, principles, and designs are communicated, including through words (texts, arguments) and drawings.
- Atmosphere (Architectural): The overall qualitative sensory experience of a space, encompassing aspects like light, temperature, sound, and spatial perception.
- Injunction Speech: A type of discourse that provides instructions, commands, or dictates, often presenting information as established facts or rules (e.g., Doyon and Hubrecht’s historical account).
- Argumentative Speech: A type of discourse that aims to persuade or convince through logical reasoning, evidence, and counter-arguments (e.g., Le Corbusier’s defense of the ribon window).
- Descriptive Speech: A type of discourse that objectively reports facts, measurements, or observations without explicit interpretation or persuasion (e.g., the LUX magazine study or simulation results).
- Narrative Speech: A type of discourse that tells a story or describes a subjective experience, often evoking emotions or providing a personal perspective (e.g., Vermeer’s artistic interpretation of light).
- Daylight Factor: A measure used in lighting design, expressed as a percentage, indicating the ratio of internal illuminance at a point to the illuminance simultaneously available outdoors under an overcast sky.
- Illumination (E): The amount of luminous flux (light) falling on a given surface area, measured in lux (lm/m²).
- Luminance (L): The photometric measure of the luminous intensity per unit area of light traveling in a given direction, perceived as brightness, measured in cd/m² (nits).
- Grasshopper: A visual programming environment integrated with Rhino 3D modeling software, used for algorithmic design, parametric modeling, and environmental analysis.
- Ladybug Tools: A collection of environmental plugins for Grasshopper (including Ladybug and Honeybee) used for climate analysis, solar radiation studies, daylighting, and energy simulations.
- EnergyPlus Weather File (.epw): A standard file format containing hourly weather data for a specific location, used by building simulation software for environmental analysis.
- Parametric Geometry: 3D geometry whose shape and properties are controlled by variable parameters (e.g., sliders in Grasshopper) rather than fixed dimensions, allowing for easy exploration of design variations.
- Context Geometry: In a simulation, the surrounding objects or surfaces that might influence the performance of the primary « analysis geometry » by casting shadows or reflecting light.
- Analysis Geometry: The specific surface or object within a simulation whose performance (e.g., solar radiation incidence) is being measured and evaluated.
- Galapagos: A built-in optimization solver component in Grasshopper that uses evolutionary algorithms to find optimal solutions for design problems by iterating through numerous parameter combinations to achieve a defined « fitness » goal.
- Genome (Galapagos): The input parameter(s) that Galapagos is allowed to vary during the optimization process (e.g., a number slider controlling orientation).
- Fitness Value (Galapagos): A single numerical output that quantifies how « good » a particular solution is, which Galapagos aims to minimize or maximize (e.g., total solar radiation).
- DOYON Georges & HUBRECHT Robert , Rural and bourgeois architecture in France , p.30, Editions Ch.Massin et Cie, 521p. ↑
- Op.Cit. p.32 ↑
- Le Corbusier and Pierre Jeannenet , Complete Works , 1910-1929, Zurich, Les éditions d’Architecture, T1, 1964, p.129 ↑
- CHAUVEL, DELETRE, BARTHES, daylight in interior spaces, French Lighting Association, LUX, Paris, 1983 ↑
- Op.Cit. p.22 ↑
- Op.Cit. p. 93 ↑
- This is a well-known property of Gestalt, see:
KANIZSA Gaetano , The grammar of seeing, essays on perception , Diderot Editeur, 1998, 400p. ↑
- Quoted by KONINGSGERGER Hans , Vermeer and his time , p.132, Time Life, 1967, 192p. ↑